
Ed Plowden is Guilty of Cherry Picking SBLN Monitoring Data
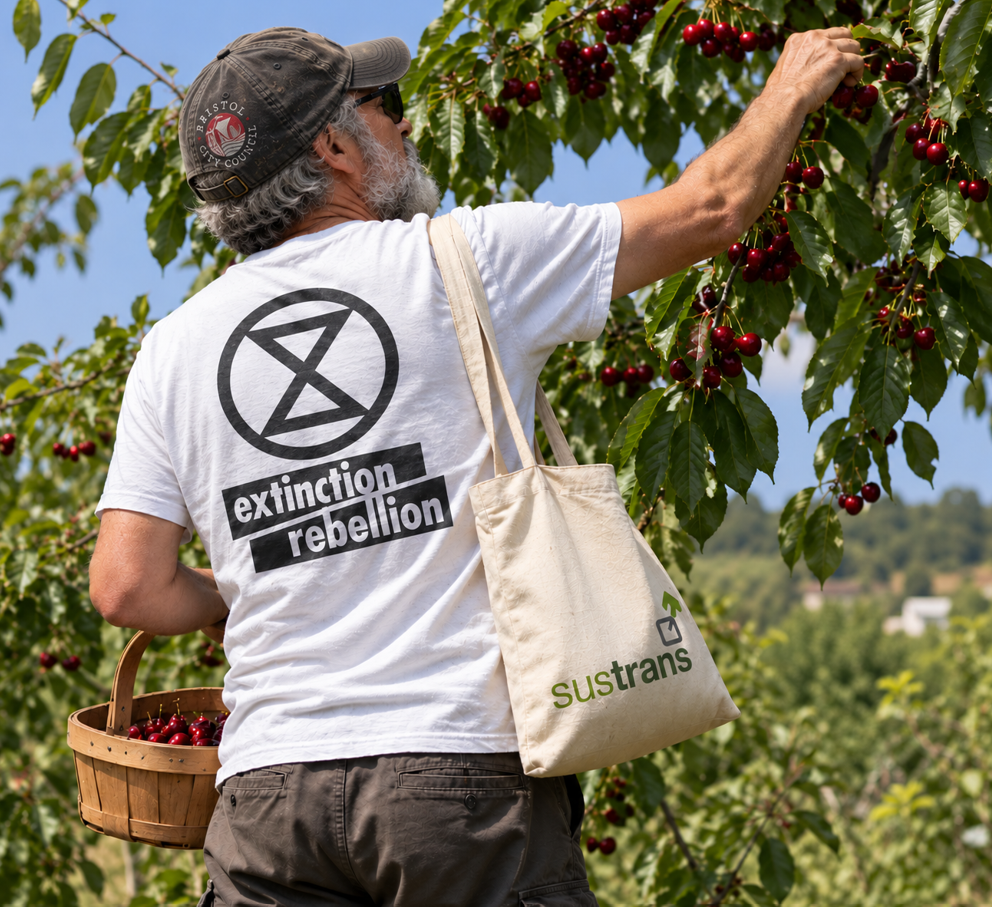
At the Transport & Connectivity Committee on 5th Feb 2026, when commenting on a Public Forum contribution about monitoring data for the SBLN, Ed Plowden stated:
"you have to look at all the data, and not cherry pick it" (see video recording)
This is a very reasonable point to make, that any reasonable person would support.
What is "Cherry Picking"?
Cherry picking is the selective choosing of the most beneficial, profitable or attractive items from what is available. In the legal science, journalism and epidemiology, the term refers to a reporting bias or the act of selectively suppressing evidence. The fallacy of incomplete evidence is the act of cherry picking that focuses on individual data, case report and anecdotal evidence that seem to confirm a particular pre-established position while wilfully ignoring a significant portion of related and similar cases or data that may contradict that position.
It is now very clear that BCC have been "cherry picking" the data with regard to traffic monitoring in the SBLN Area.
VivaCity Sensors on North Street
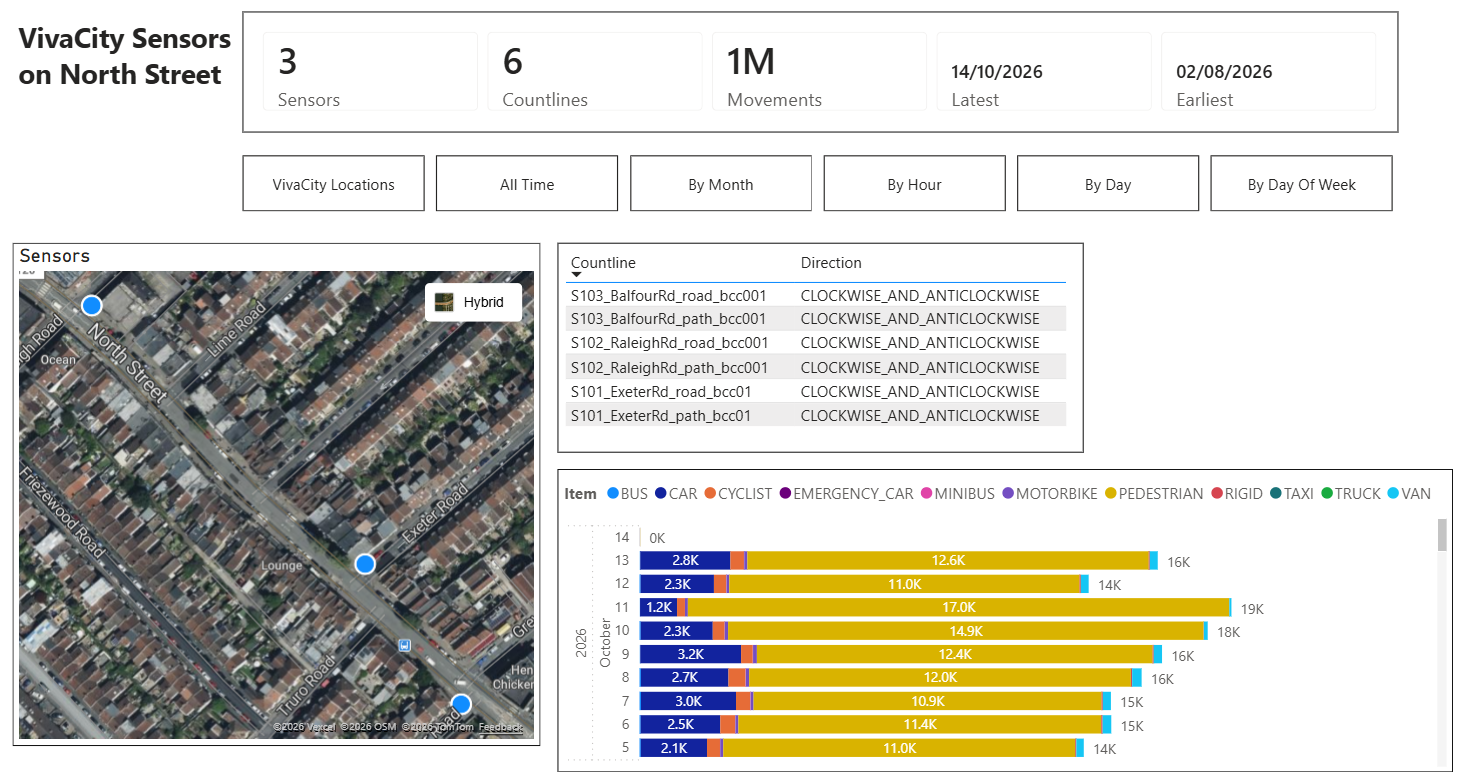
There are 3 Vivacity Sensors that were installed on North Street sometime in 2026. The exact date is not known because BCC denied the sensors were installed when an FOI request was submitted to them (Ref:75059033 'VivaCity Sensor data in SBLN area') asking for information about them,
After repeatedly chasing up the FOI request (for 4 months) BCC eventually admitted to one Vivacity Sensor being in place with one "Countline".
There are actually 3 VivaCity Sensors on North Street junctions.
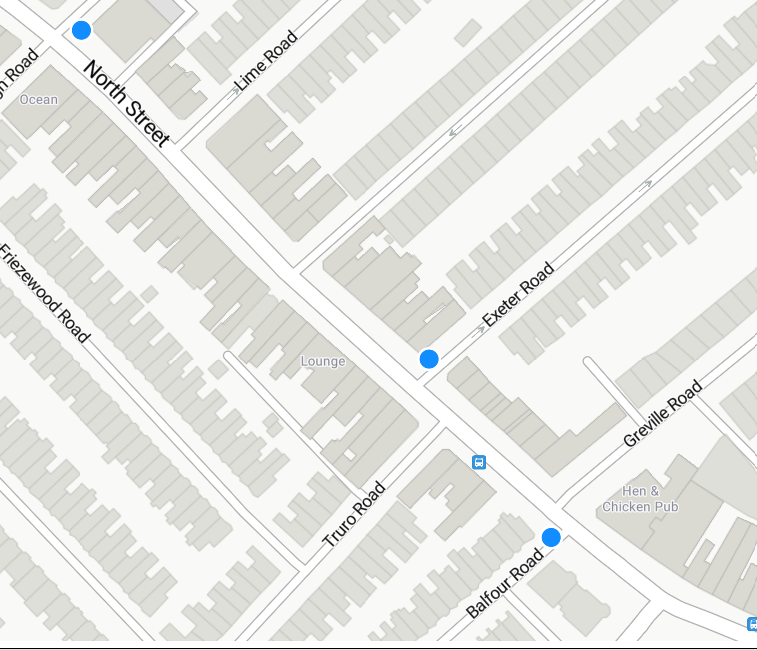
Each sensor can have multiple "Countlines".
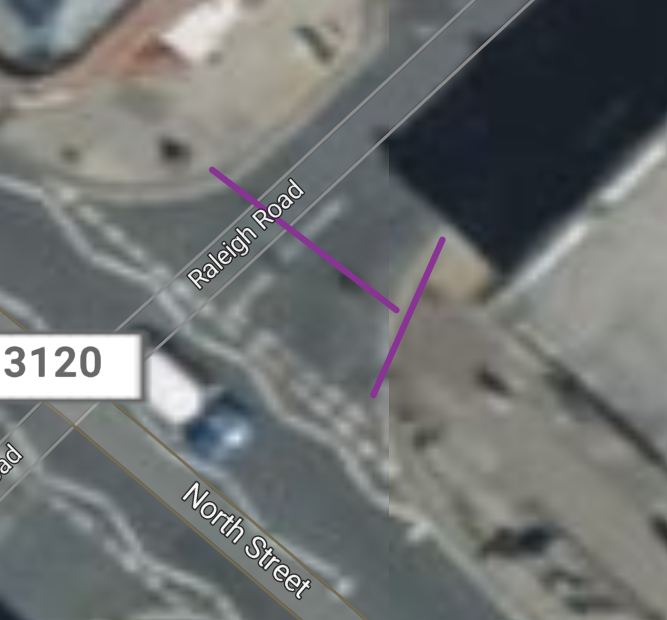
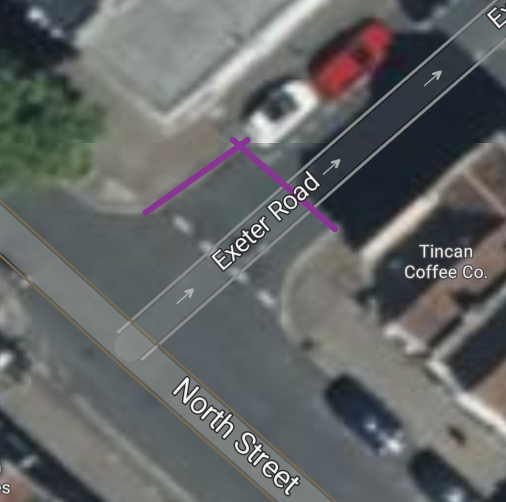
These are how the North St Sensor Countlines are configured:
Raleigh Road
S102_RaleighRd_road_bcc001
S102_RaleighRd_path_bcc001
Exeter Road
S101_ExeterRd_road_bcc01
S101_ExeterRd_path_bcc01
Balfour Road
S103_BalfourRd_road_bcc001
S103_BalfourRd_path_bcc001
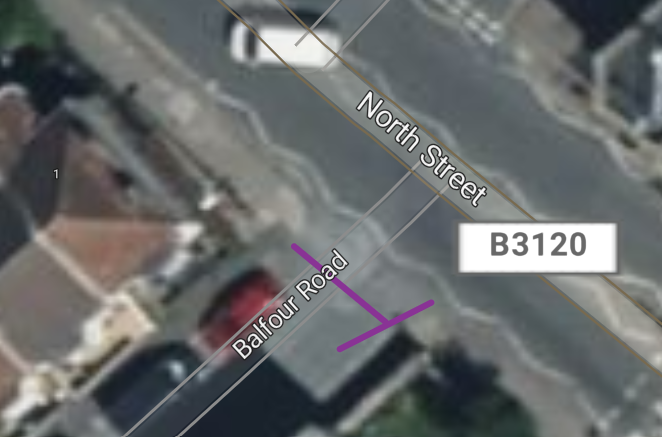
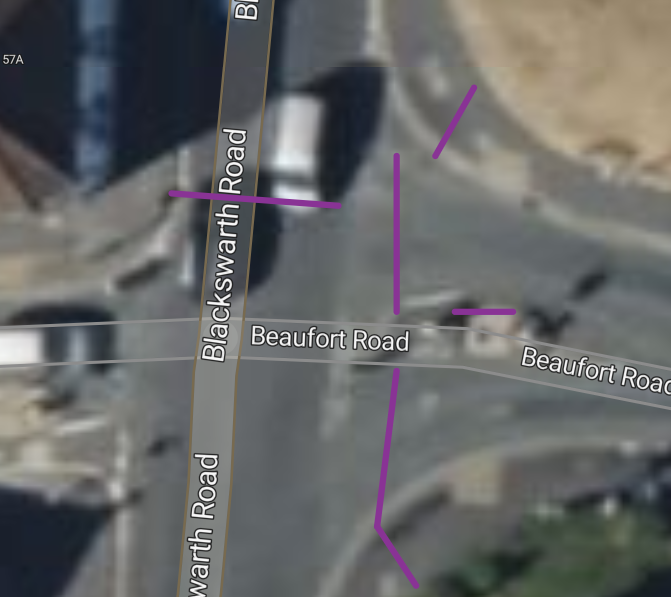
How many Countlines can you have for a sensor?
Here are the six countlines for a VivaCity Sensor on Blackwarth Road.
And there are 9 countlines set up on this sensor on College Green.
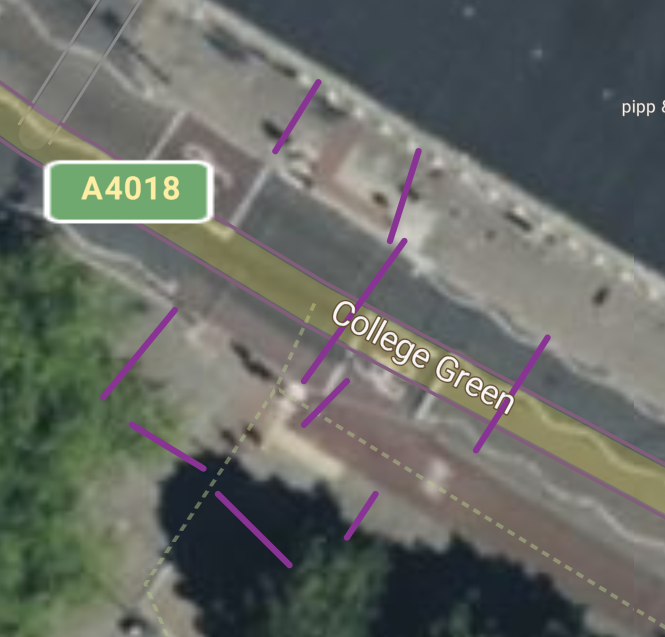
This shows that sensors can be installed and configured to collect data from many more than 2 countlines.
Why is there no data collection for North St?
The most logical explanation for not collecting data for North St is that BCC do not want to collect Vivacity sensor data for North Street because it would be very likely to provide embarrassing evidence about the expected increase of motor traffic on North Street as a result of the SBLN proposals being implemented.
BCC will use their "cherry picked" data to evidence the "success" of the SBLN by pointing to a reduction of traffic on Raleigh Road, whilst at the same time suppressing the objective data that would show an increase in traffic on North Street.
This selective collection of data is not a mistake. BCC are just following the same playbook that they used for the EBLN when they placed sensors there.
You can read the full explanation of their monitoring strategy in the EBLN in this article: Gerrymandered Traffic Data? - EBLN Monitoring Report: A closer look at the crafty positioning of the traffic sensors.
And The EBLN Cups and Balls Routine.
When WECA published the "East Bristol Liveable Neighbourhood: an Independent Review", one of the "learnings" for the SBLN was to:
It seems that Ed Plowden and BCC did not take this learning point on board.
All of the sensor data reference in this article can be found on the BCC Open Data Portal.
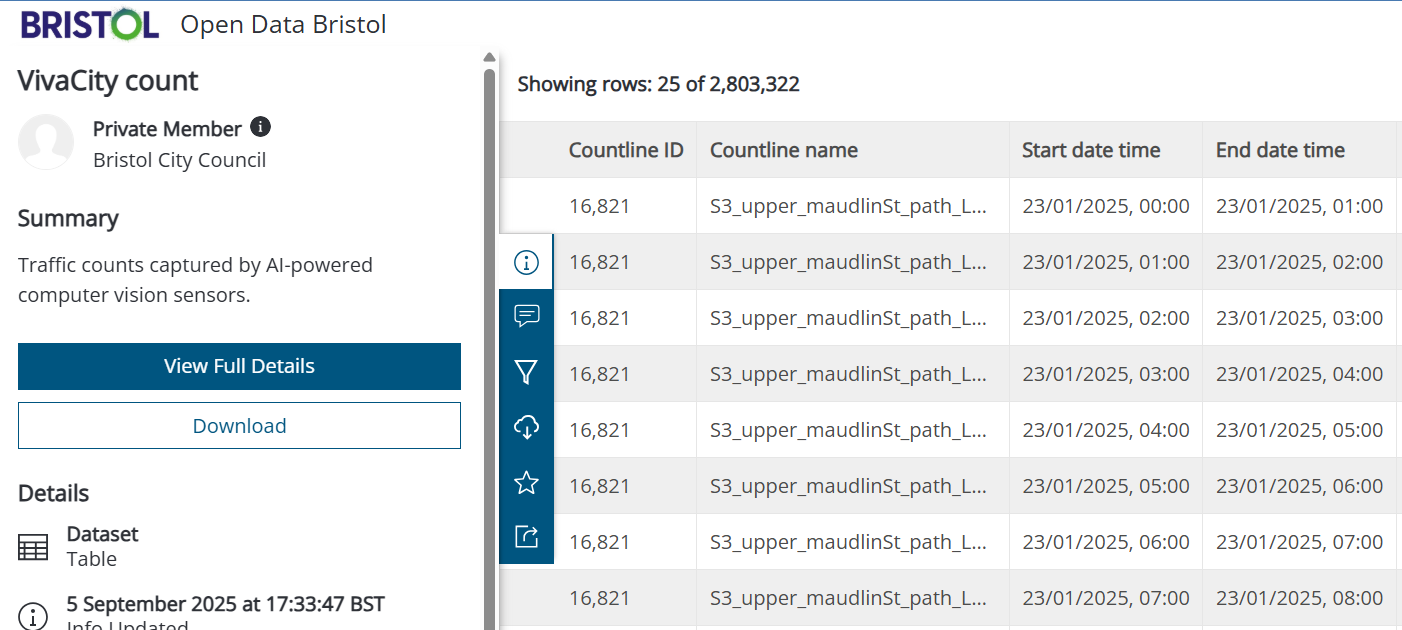
But, you will find it very difficult to make much sense of the data in this format.
I have produced a report that shows all of the North St VivaCity Sensor data in a form that is much easier for humans to understand.
Comments ()