Bristol Uncovered Usage Data
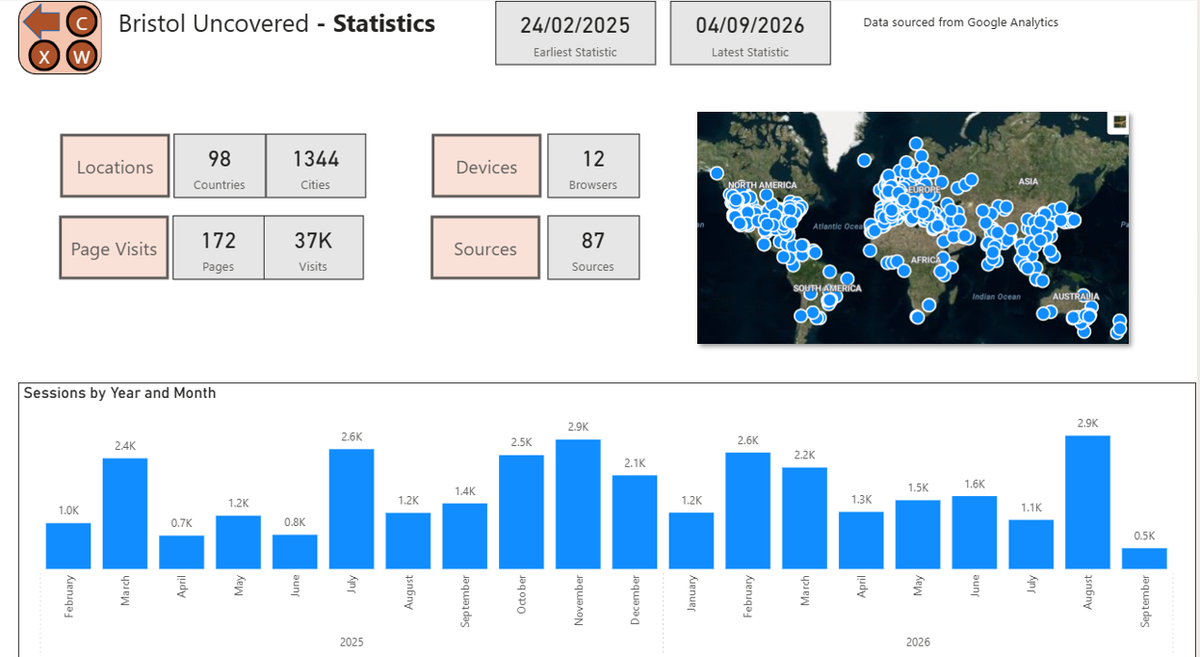
Instead of looking at other people's data I thought I would produce a report on the usage data for Bristol Uncovered to give some insight of where my readers come from and what they are reading.
Bristol Uncovered was launched in Feb 2025 with a website and a set of Power BI Reports. I collect data from Google Analytics for the website, but unfortunately I cannot collect usage data for the Power BI Reports.
Where do visitors come from?
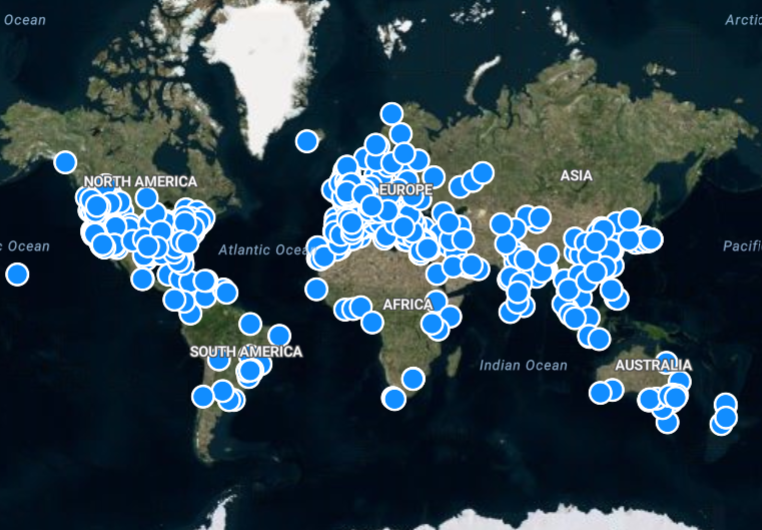
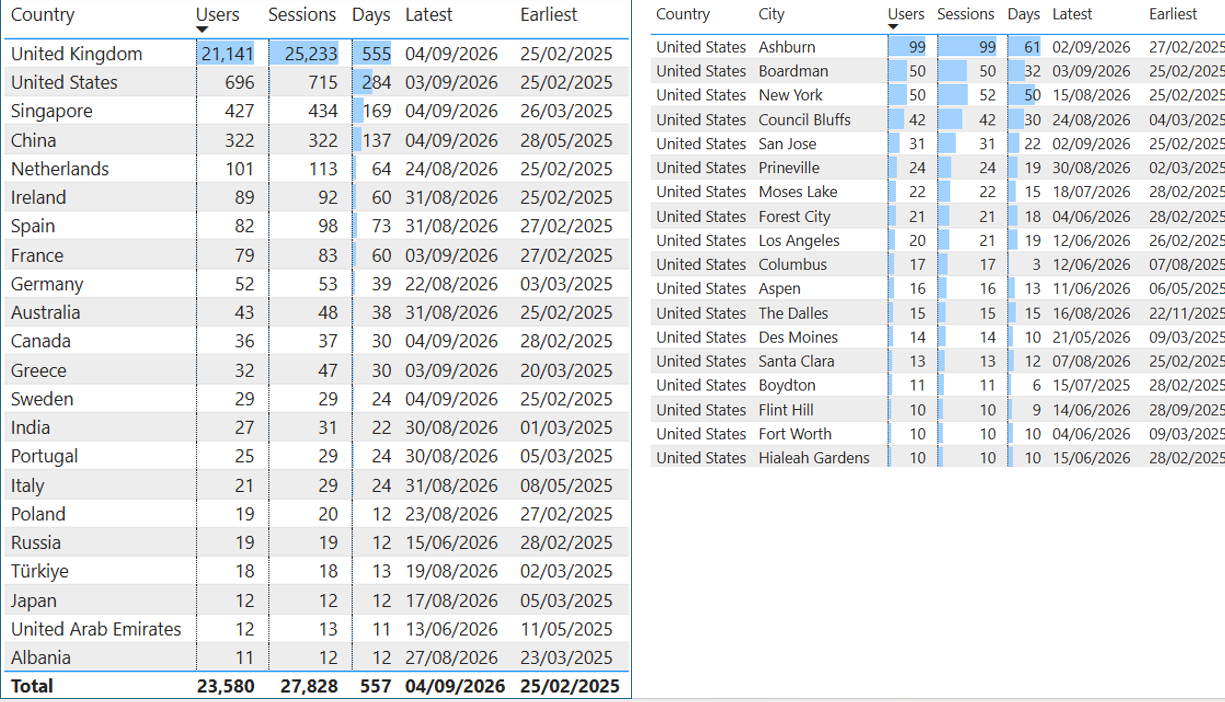
1,344 Cities in 98 Countries.
This data will be skewed by people who use Virtual Private Networks (VPNs) to access the site as it will record the location of the VPN rather than their actual location.
It is also likely to show the holiday locations of loyal BU Readers when they decide to read an article whilst sitting by the pool drinking a Pina Colada (I have not researched the drinking habits of BU Readers). There may also be Bristol ex-pats and interested foreign observers who visit BU.
As Bristol Uncovered is about Bristol, the majority of visitors are from Bristol and the United Kingdom.
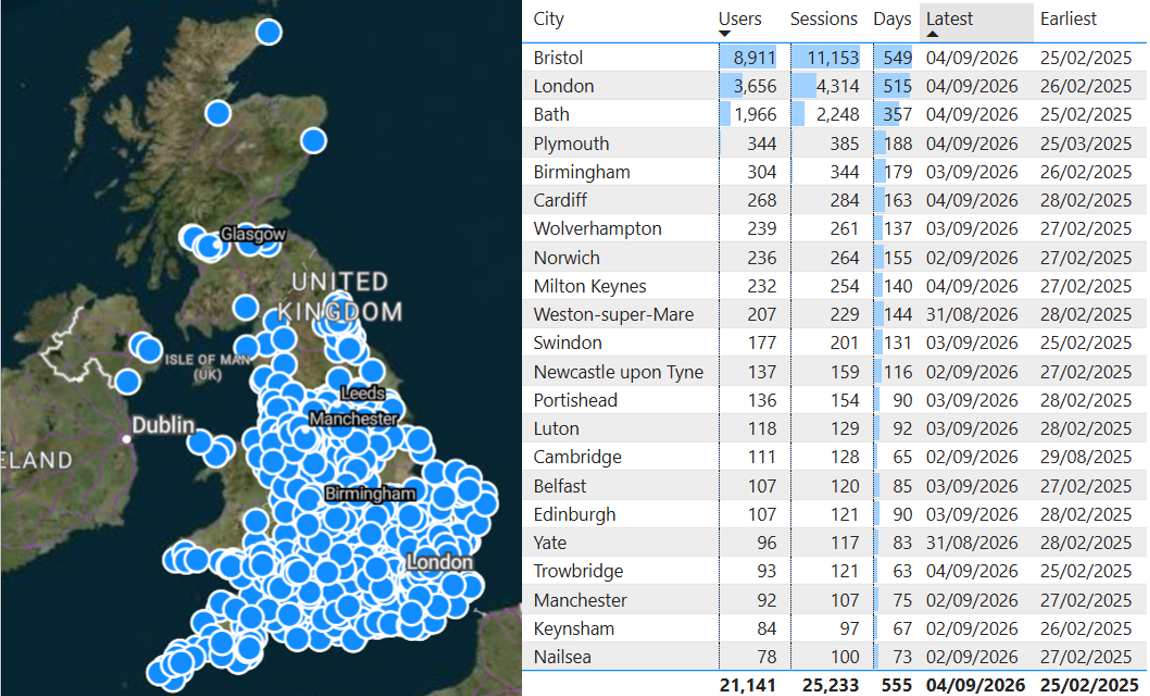
Looking at the other top countries, a lot of this traffic is likely to come from data centres who are "scraping" BU web content to feed search engines and AI models.
Ashburn in Virginia is know as "Data Centre Alley" because of the large number of data centres in that area. Boardman is a major centre for Amazon data centres.
Singapore is also a major location for data centres.
The most popular location in China is Lanzhou which is another major data centre location.
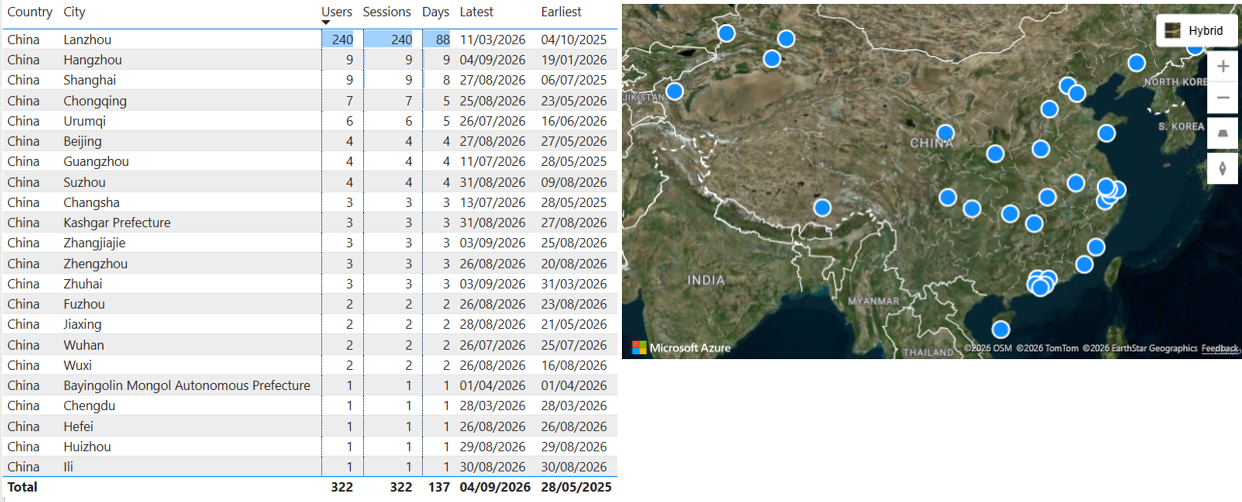
There were four visits from Guangzhou, which is twinned with Bristol. Perhaps they were reading "Why is Bristol twinned with Guangzhou?"
How do visitors get here?
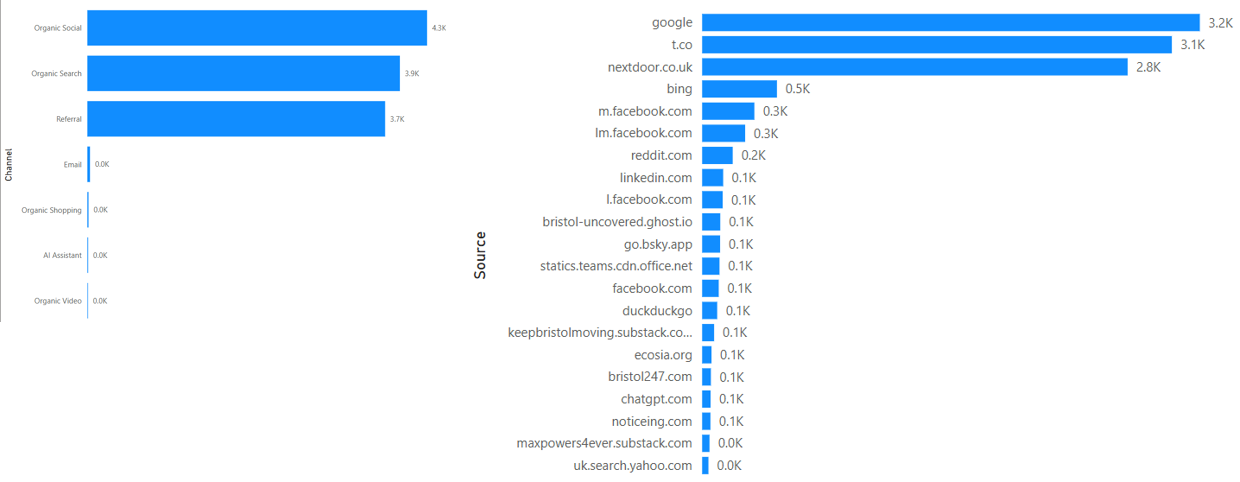
These charts show which sites people come from to get to BU. It excludes direct visits where people do not come from another site.
- t.co = X
- go.bsky.app = Bluesky
What are the most popular articles?
These charts do not include visits to the Bristol Uncovered home page.
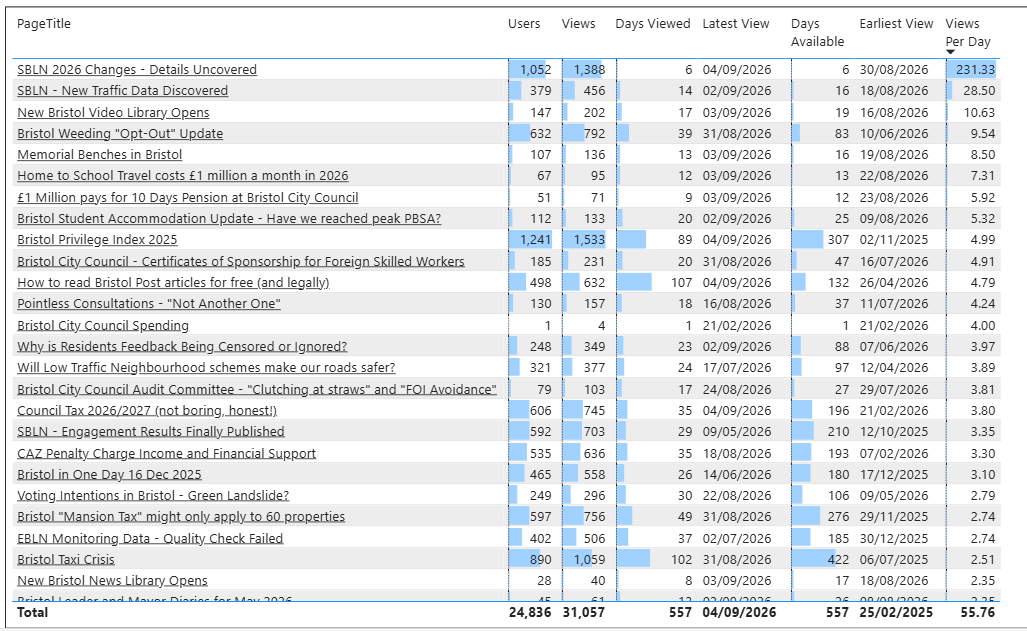
The most popular article is "Bristol Privilege Index 2025" which had 1,533 views on 89 different days.
The second most popular article is "SBLN 2026 Changes - Details Uncovered" which had 1,052 views over just 6 days.
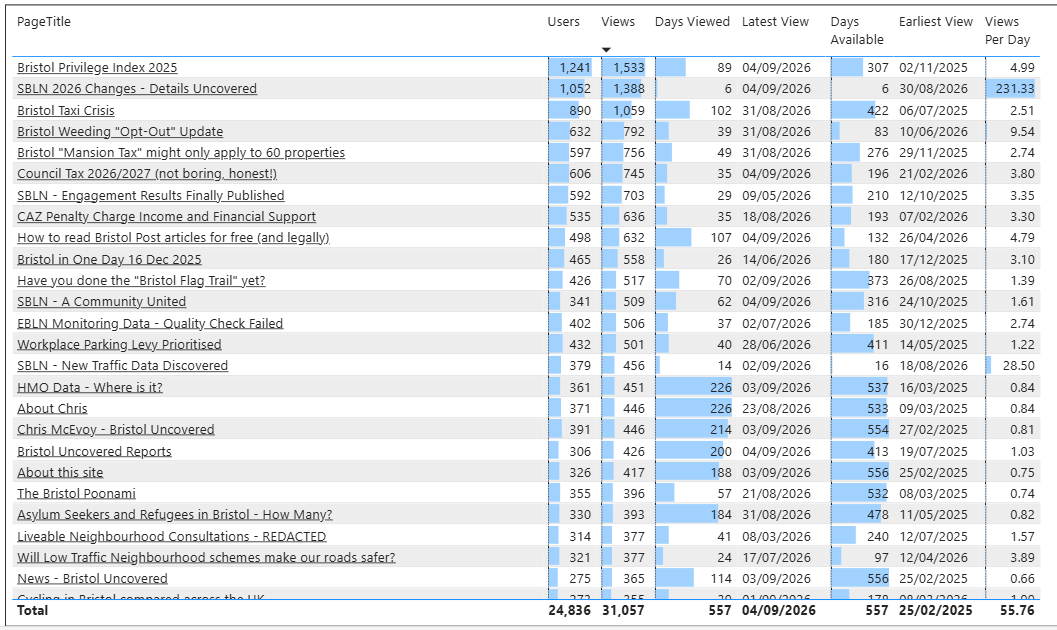
Top Articles by "Views per Day":
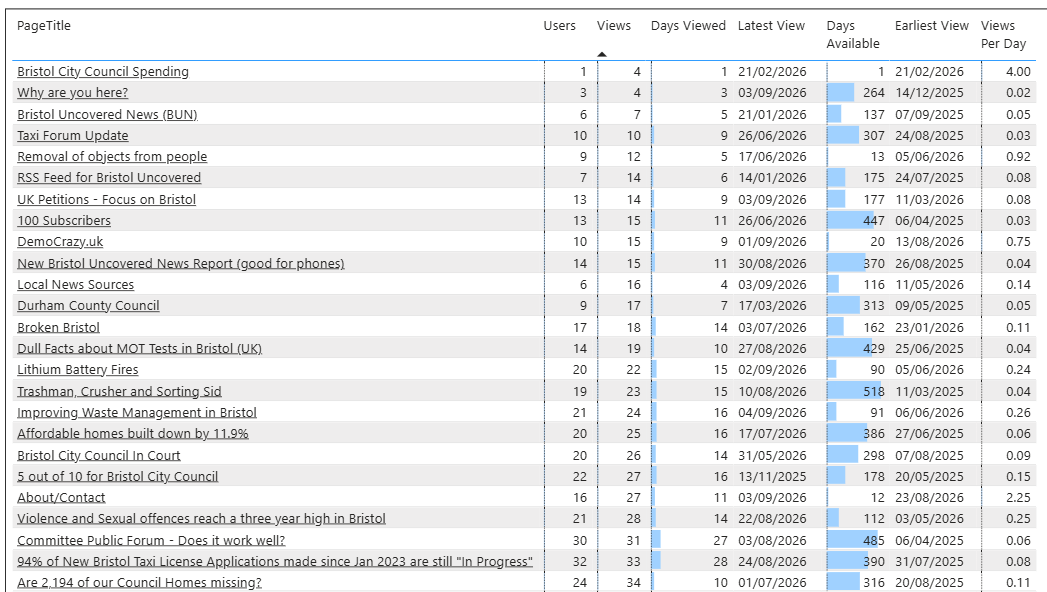
These are the least popular articles:
How do visitors engage with the articles?
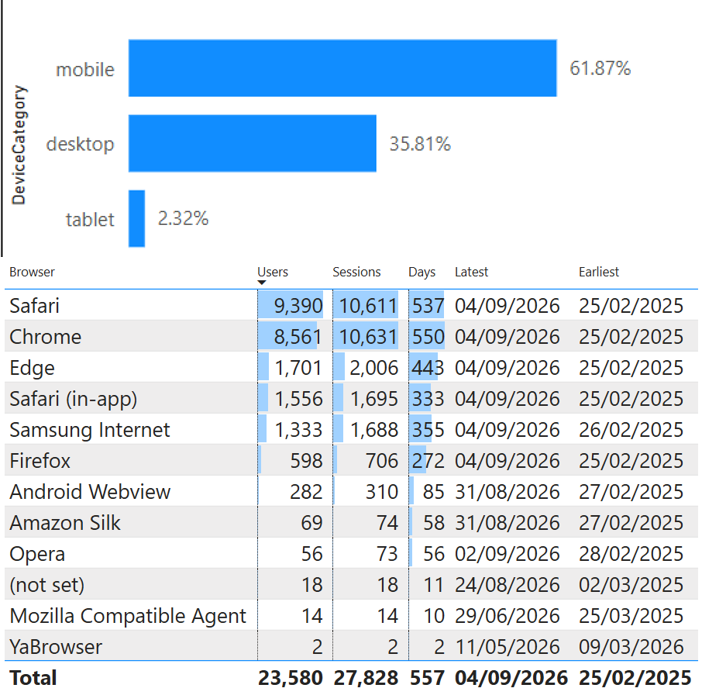
The majority of readers use their mobile device, split evenly across Apple and Android devices.
Comments ()