SBLN - New Traffic Data Discovered
BBC Radio interviewed Ed Plowden about the SBLN Consultation results and the changes being made in response to the consultation
At 03:09 you can hear Ed say this:
"Let's just look at Raleigh Road, we've got 2,500 cars a day on what is basically a residential street, that is not a great situation for anyone to be in, so yes we do want to reduce some of the rat-running or short-cutting that people are doing, That does mean we have to do something like modal filters (or so on) to make sure the scheme works"
At the Transport and Connectivity Committee on 14/05/2026 this question was submitted to the Public Forum.
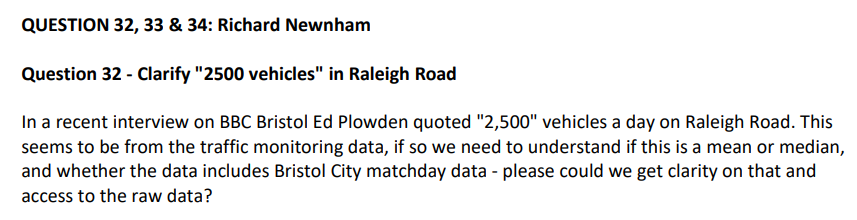
Which received this answer:
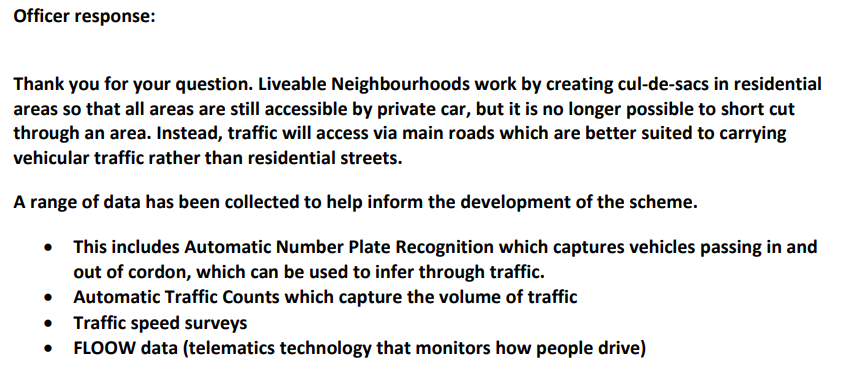
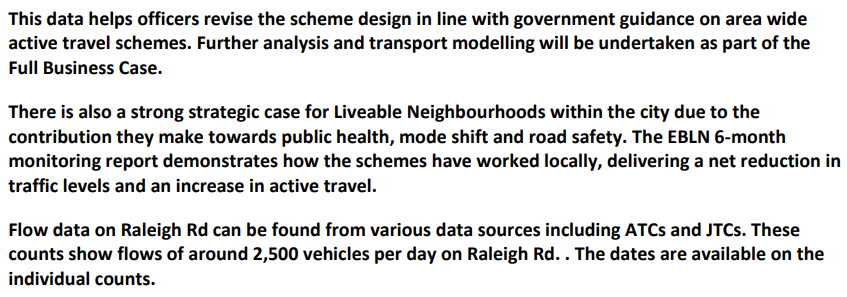
The response doesn't answer the question which is about how 2,500 a day was calculated. It references "various data sources including ATCs and JTCs" and tells us that "the dates are available on the individual counts".
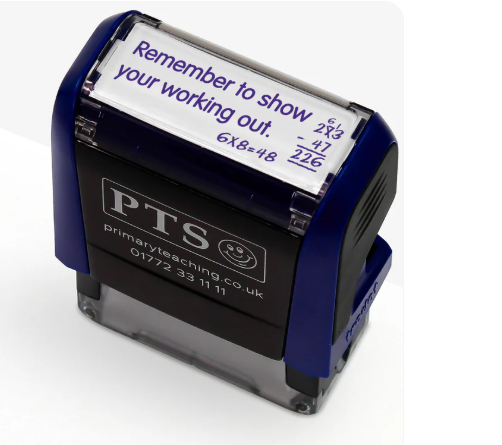
At primary school my maths teacher used to make it clear that getting the "correct" answer didn't matter unless you showed your "working out". The Council have failed to show their "working out" as they could not point to the specific data items that were used to justify the amount of "Through Traffic" using Raleigh Road.
You can read more about the apparent lack of transparency here.
Earlier this year people noticed that new sensors had been installed in Southville (I noticed this one in May).
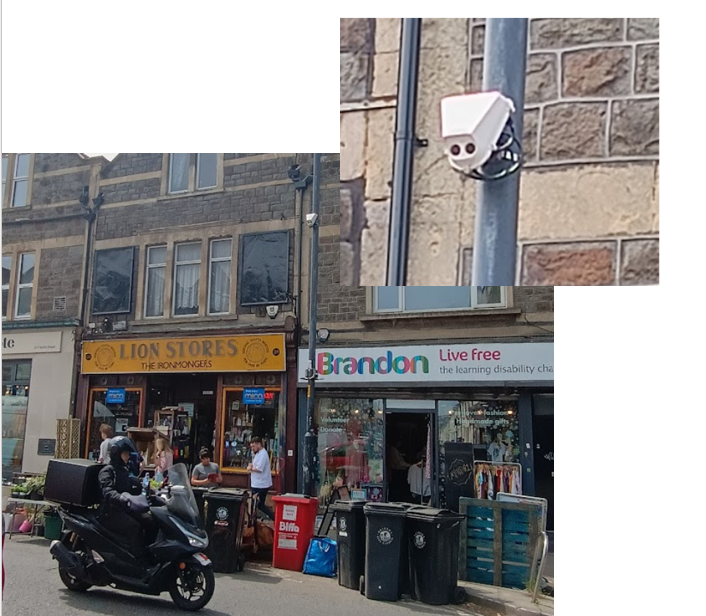
These sensors are VivaCity Sensors, which are used across Bristol to monitor "movements" of pedestrians, cyclists and motor vehicles 24 hours a day, 7 days a week. If these sensors are being used to record "movements" on North Street and linked roads then that data would be very useful in helping us understand the situation in Southville.
I monitor the VivaCity data on a weekly basis, but I could not identify data for Southville sensors on the Bristol Open Data site.
The data is refreshed every day and there was no sign of Southville sensors.
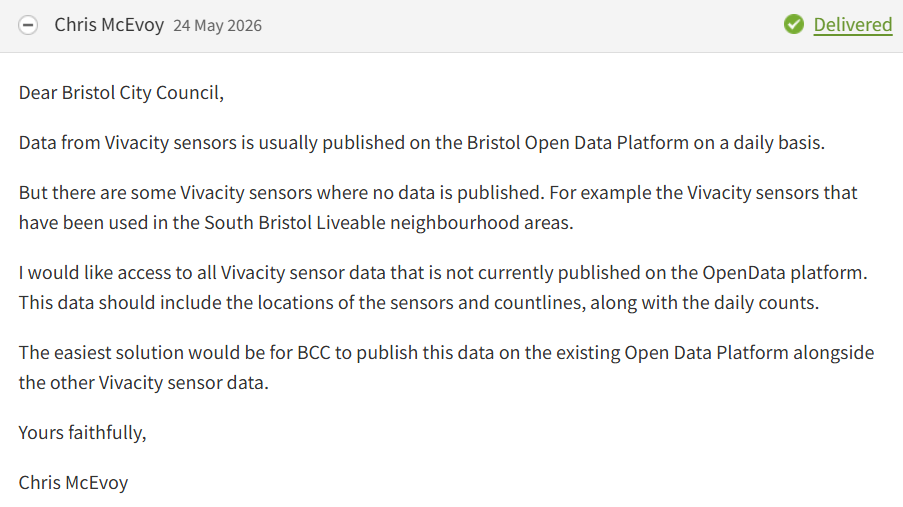
On 24/05/2026 I submitted an FOI Request to Bristol City Council.
I had not received a response by 10/07/2026 so I asked for an "Internal Review".
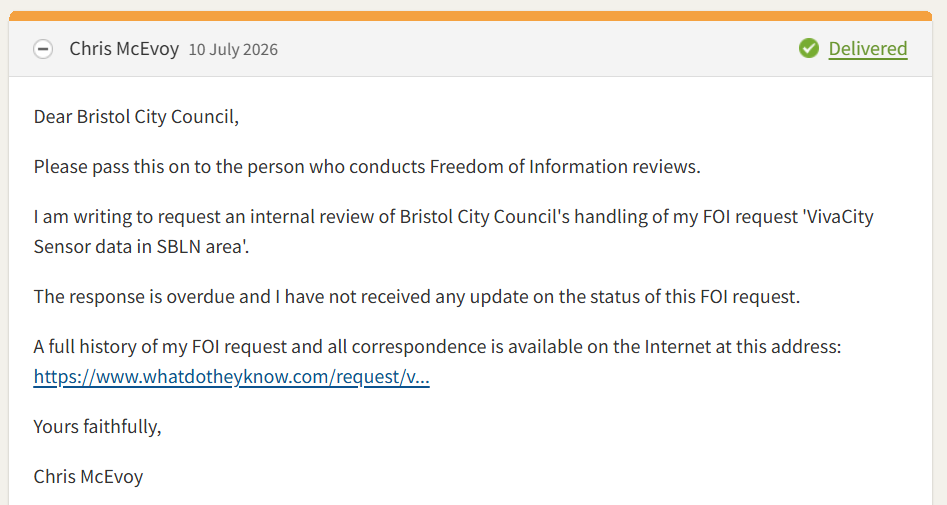
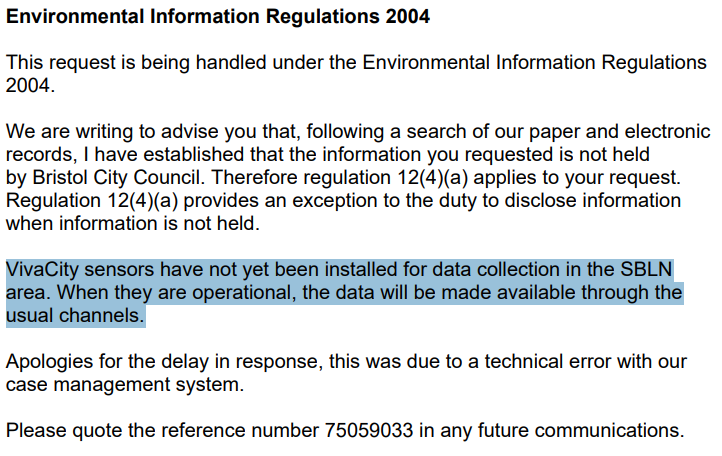
And received this response on 15/07/2026 where BCC told me they did not hold the data I requested.
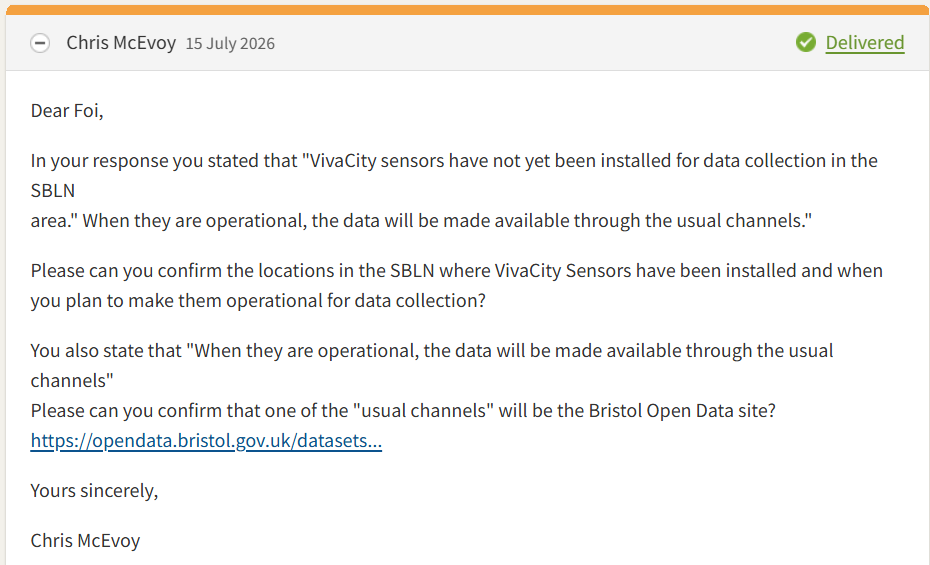
I asked for clarification.
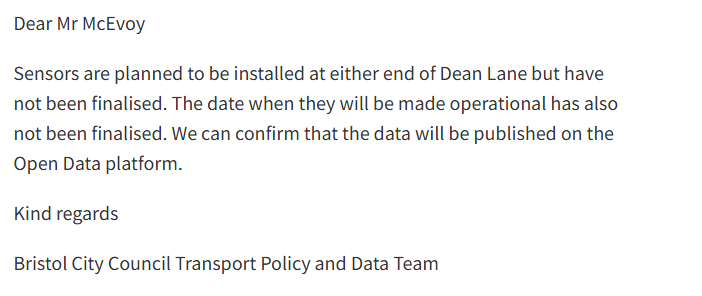
And received this response on 31/07/2026
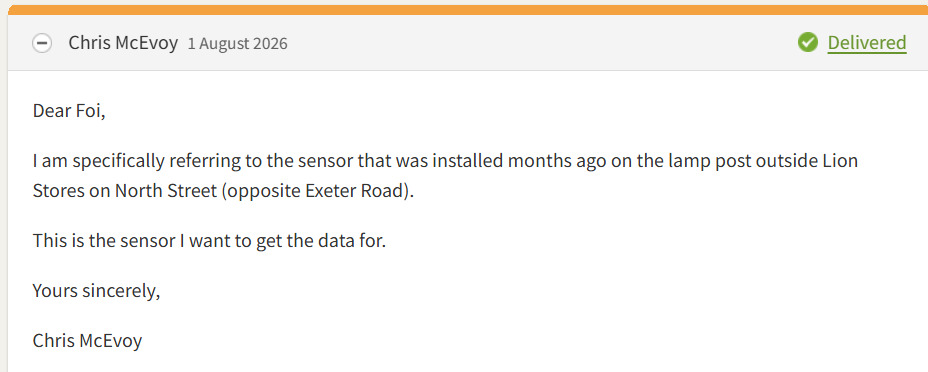
On 01/08 2026 I "clarified" my request
As of today (18/08/2026) I have had no further response to my request.
But, today when I refreshed my VivaCity Sensor Data I saw that three new sensors had appeared in Southville (all on North Street) and data was available for these sensors covering the period from 02/08/2026.
This means that the day after I sent my "clarification" to BCC the data for Southville Sensors suddenly appeared on the Open Data Portal.
Some questions that are still unanswered:
- Are there any other sensors installed in Southville?
- They have published data for 3 North Street sensors, but is that because I specifically mentioned North St?
- These sensors have been in place for months, but why is data only published for 02/08/2026 onwards?
- When did these sensors actually start collecting data, it seems a coincidence that they have only published data on the day after I told them I knew about the specific sensor outside of Lion Stores on North St?
- Why haven't I received a response to my FOI Request? (as at 18/08/2026)
What does the newly revealed data show?
Sensor Locations
The blue circles show the location of the sensors, and the purple lines show the "Countlines" for each sensor.
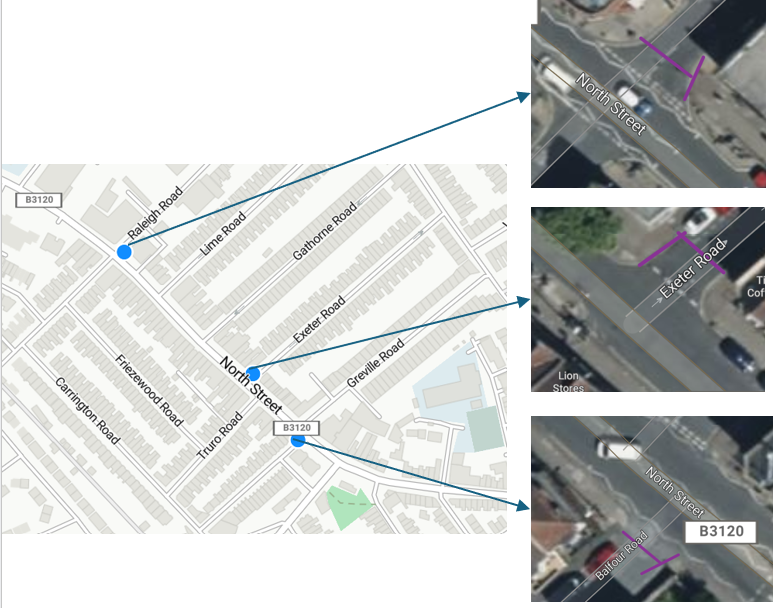
It is very surprising that the sensors are not collecting data for countlines on North St. This means that these sensors have been specifically configure not to collect movements on North St, or the data is being collected but not published.
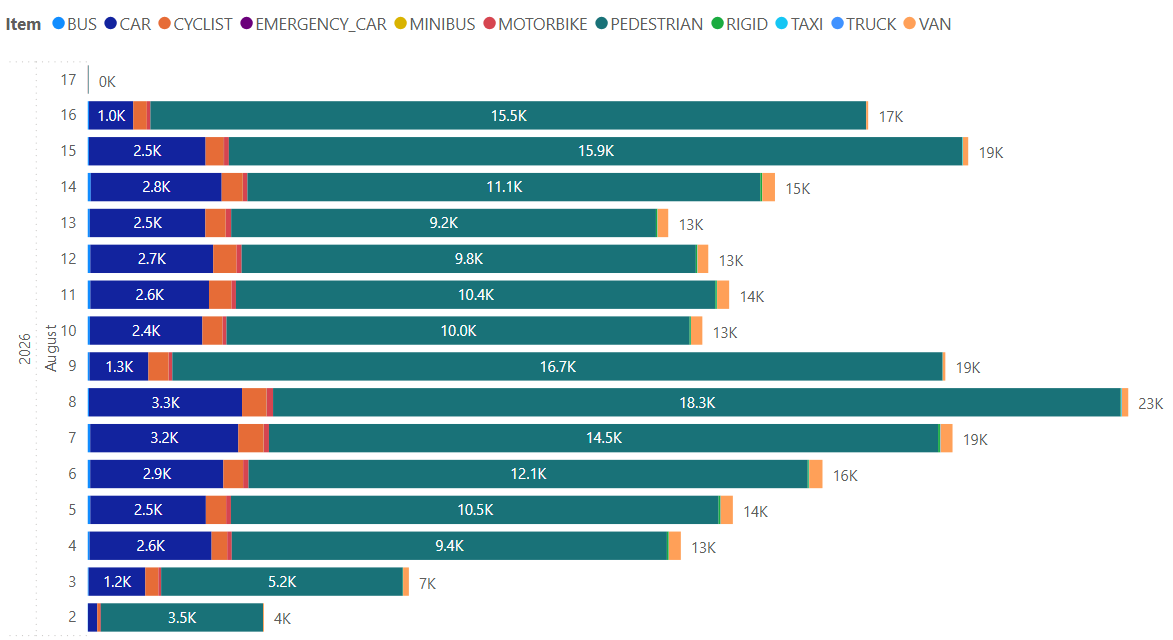
Sensor Data Collection Dates
The recent lane closure on Coronation Road that started on 27 July 2026 has caused traffic to be displaced onto North St as it is often quicker for drivers to get to the other end of Coronation Road (in both directions) via North St. I live on Coronation Road and have started using North St instead and I expect other drivers do the same.
If sensor data had been published for May, June and July we would be able to see if their were any impacts on Raleigh Road as I expect that more people are using Raleigh Road to avoid the Coronation Road lane closure.
We wouldn't know the direct impact on North St as BCC decided not to measure North St movements.
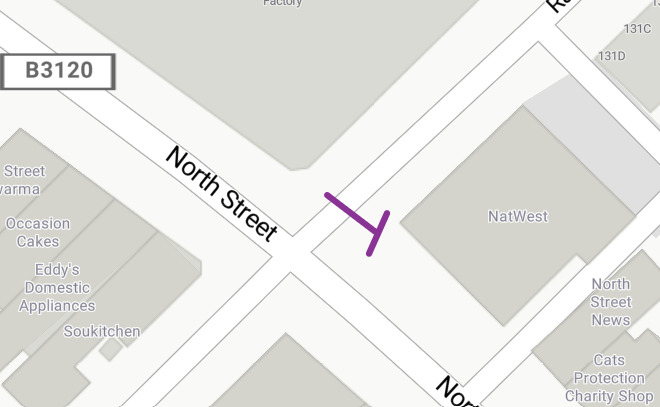
Raleigh Road Junction
There are 2 countlines on the Raleigh Road junction. They count movements in both directions.
One covers the road, and the other covers the pavement on the "Nat West" side.
Raleigh Road Countline (Road)
This chart shows the movement counts (in both directions) on the road countline.
You can see the impact of events in the area.
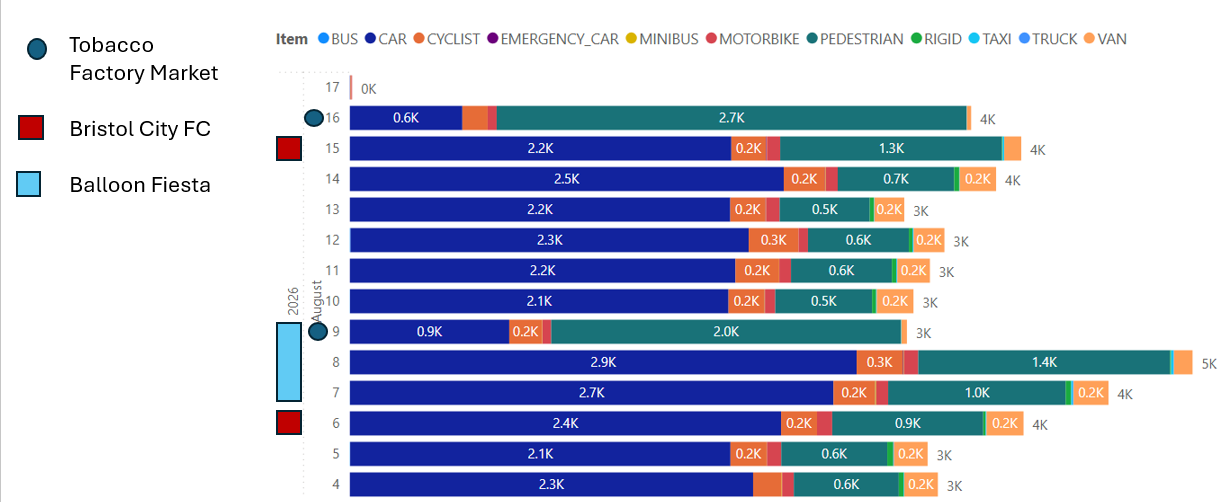
This shows that the figure of "2,500" cars a day on Raleigh Road is supported by this data. But it does not help us understand how many of the movements are "through traffic".
These are the totals for the dates in the chart shown above.
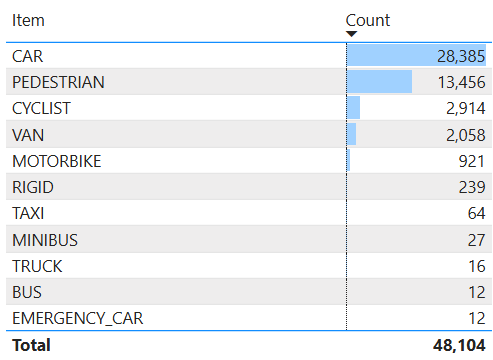
There is a lot more analysis that needs to be done with this data.
People can access the source data on the Bristol Open Data Portal.
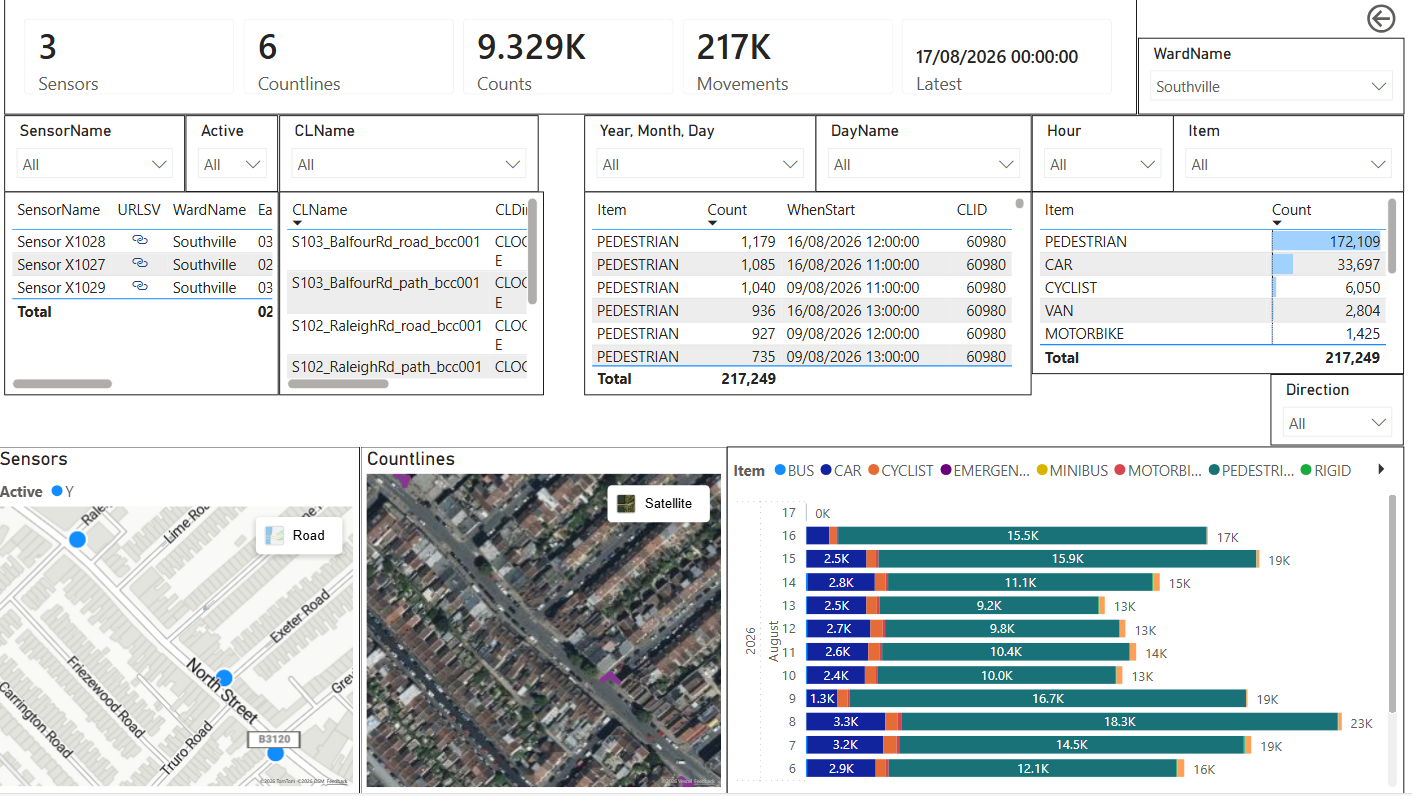
But you may find it easier to explore the data on my Bristol Traffic Report.

You can filter on the "Southville" Ward to see the sensors on North Street.
Comments ()