
Will Low Traffic Neighbourhood schemes make our roads safer?
The introduction of the East Bristol Liveable Neighbourhood (ELBN) and South Bristol Liveable Neighbourhood (SBLN) schemes are informed by benefits and impacts documented in the Liveable Neighbourhoods Handbook.
The handbook describes how the schemes will be monitored. For example this is how the levels of physical and perceived safety will be monitored.
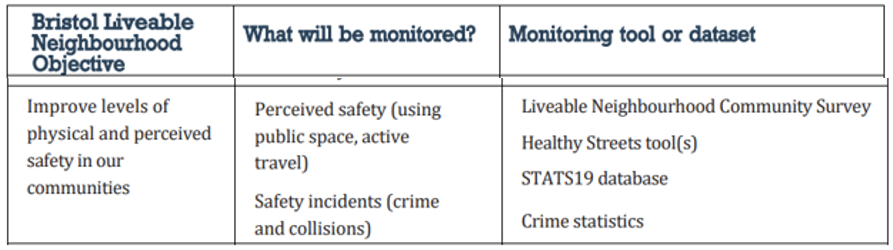
This article will look at the monitoring of "Traffic Collisions" data from the STATS19 database, as this is the most objective source of data for safety.
EBLN Monitoring
The EBLN monitoring data produced includes one spreadsheet that contains basic STATS19 data.
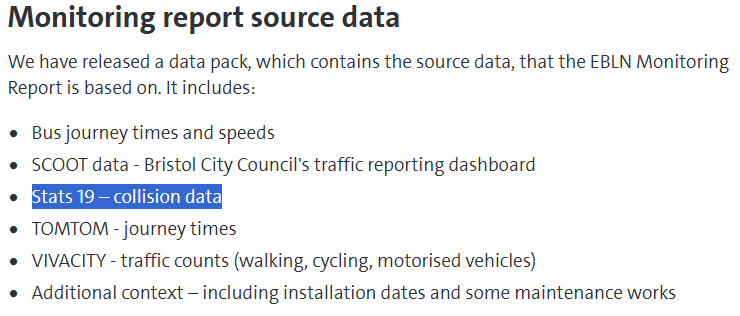
The STATS19 spreadsheet only contains summary totals for the collision data and does not contains any rationale of explanation of how the EBLN will impact traffic safety.
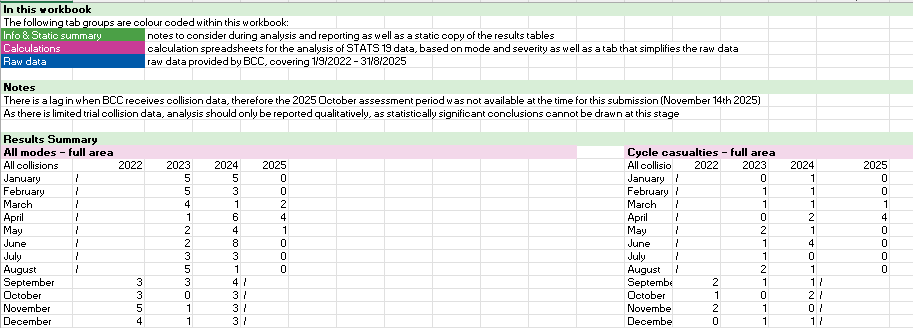
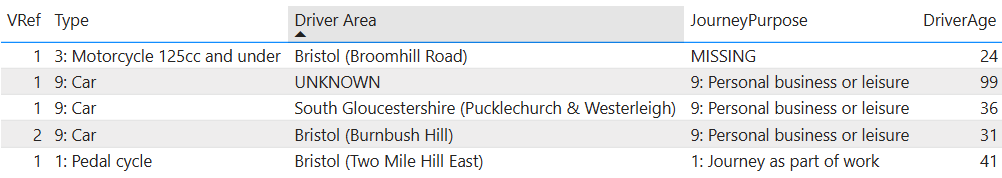
Sample rows from "Summary Listing":
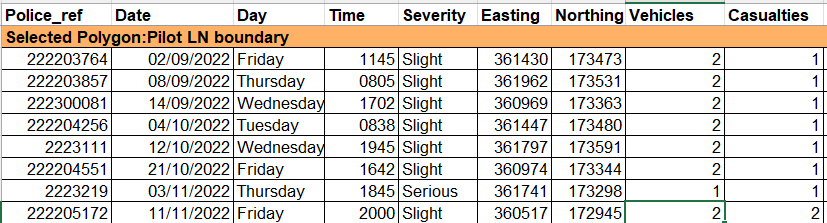
I have not been able to trace any of the data in this spreadsheet to the STATS19 data. This could mean that this data was not sourced from the official STATS19 data.
SBLN Monitoring
The SBLN Monitoring Data does not contain any analysis of the relevant STATS19 data.
Bristol Uncovered Analysis
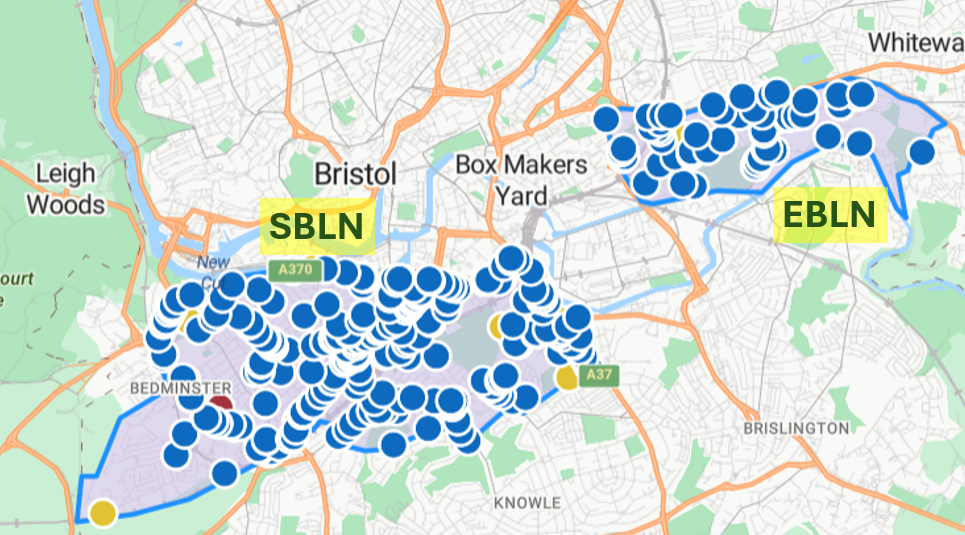
I have looked at the most objective data in the list above, which is the STATS19 Database which records data on personal injury road collisions, the vehicles involved and the consequential casualties.
I have taken the published data for Bristol from 2020 to 2024, and also included the provisional data for the first half of 2025.
I have identified which collisions took place in the SBLN and EBLN, and produced a number of "facts" related to the collision, vehicles and casualties.
This analysis can be used to understand the likely impact of the LTN schemes on safety related to vehicle collisions.
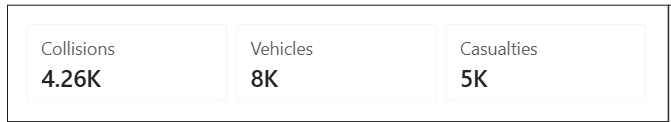
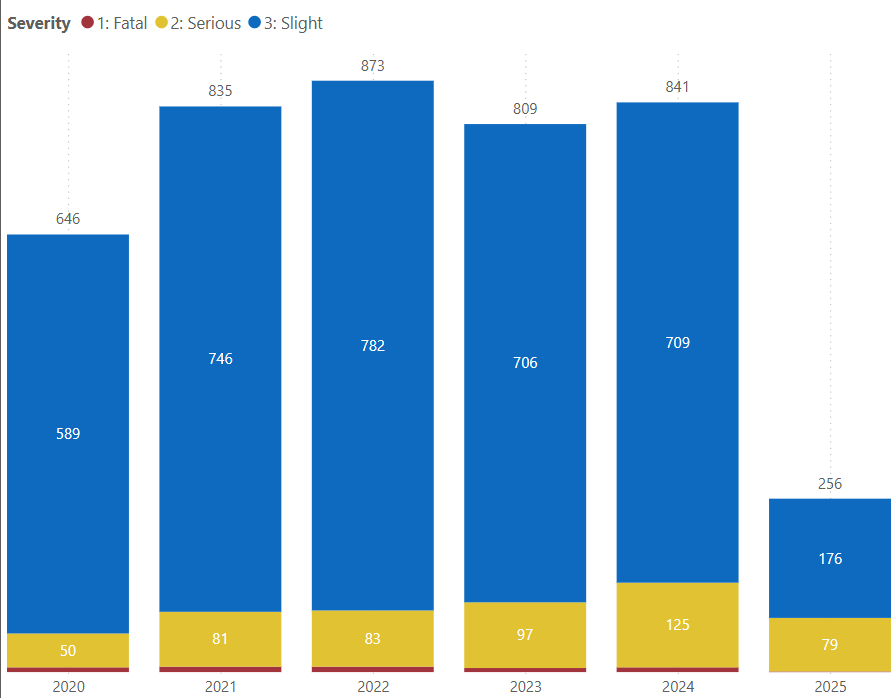
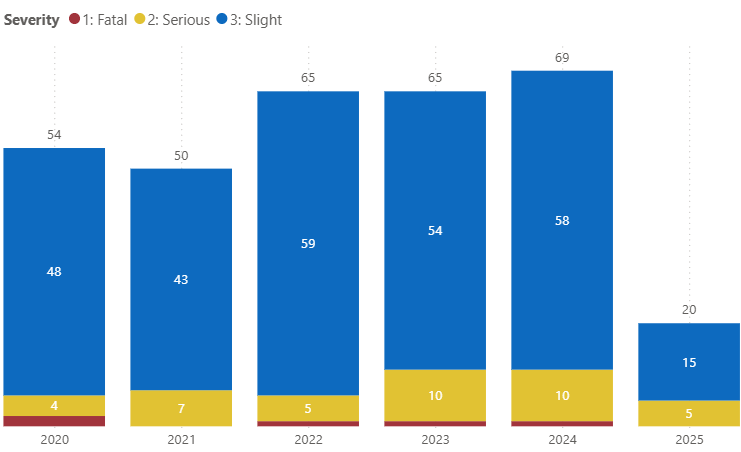
Bristol Collisions
The data for 2025 is incomplete and will be fully published in September. I have included it as it does provide a partial picture of the more recent data for 2025.
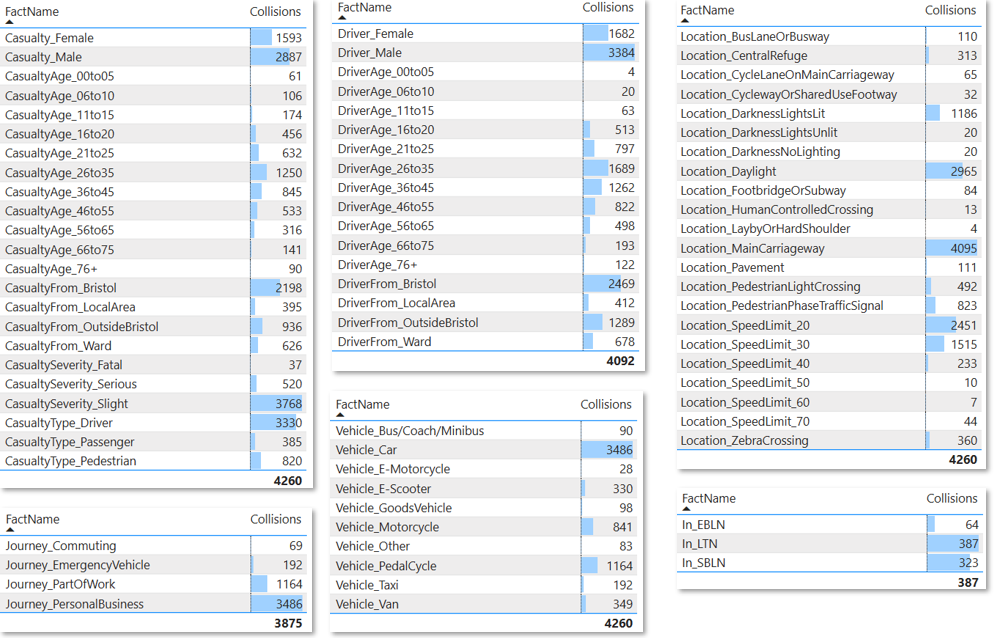
Collision Facts
These are the "facts" that I have generated from the STATS19 data. The totals for different "facts" do not always match the total number of collisions as I only include data that is provided and do not include data items that have not been populated.
The In facts are related to the location of the collisions. It shows which collisions are in the EBLN and the SBLN.
The Location facts are related to the location of the collision.
The Vehicle facts are related to the vehicles involved in the collision.
The Driver facts are related to the drivers involved in the collision.
The Casualty facts are related to the casualties involved in the collision.
The Journey facts are related to the reason for the journey.
The From facts relate to where the driver/casualty lives:
- Local Area - This is the area/neighbourhood the person lives in where the Area of the collision is in the same Area
- Ward - This is the Ward the person lives in where the collision is in the same Ward
- Bristol - The person lives in Bristol but not in the Area/Ward of the collision
- Outside Bristol - The person lives outside of Bristol
Some Example Fact Descriptions
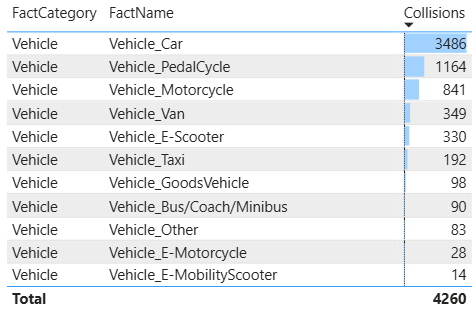
- 3,486 of the vehicles involved were Cars
- 1,164 of the vehicles involved were Pedal Cycles
- 330 of the vehicles involved were E-Scooters
- 1,289 of the drivers were from Outside Bristol
- 936 of the casualties were from Outside Bristol
- 412 of the drivers were from the same Local Area as the collision
- 323 of the collisions were in the SBLN
- 64 of the collisions were in the EBLN
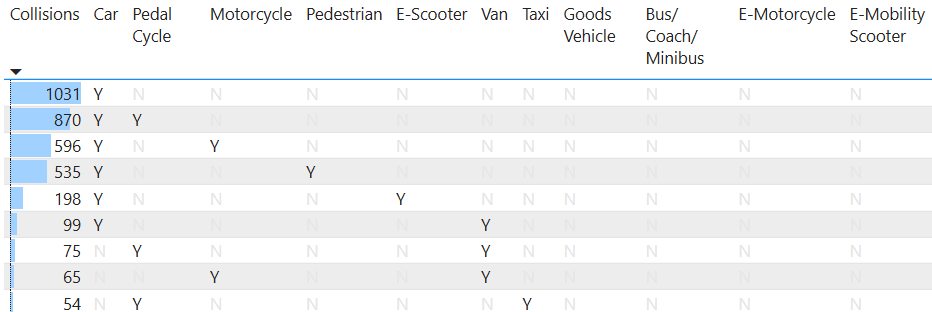
Collision Combinations
This data shows the combinations of vehicles and people involved in collisions.
These are the "Top 10" most common combinations, and shows useful information about the vehicles and people that are involved in individual collisions.
- 1.031 collisions only involve Cars
- 870 collisions involve Cars and Pedal Cycles
- etc. etc
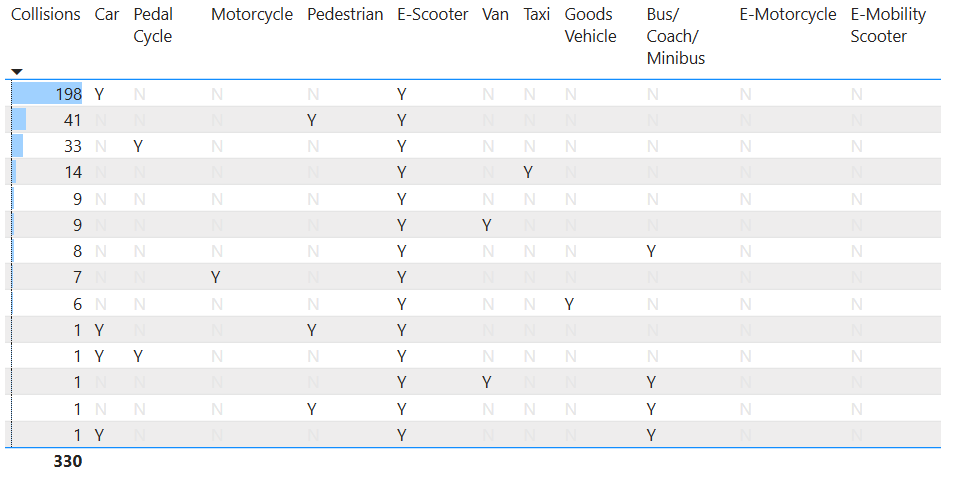
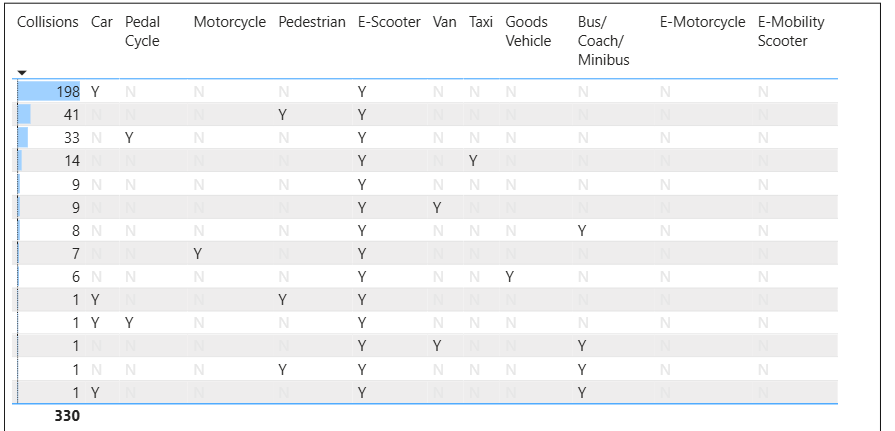
These are the combinations that involve E-Scooters
- 41 collisions only involve E-Scooters and Pedestrians
- 1 collision involves an E-Scooter, Pedestrian and a Bus/Coach/Minibus
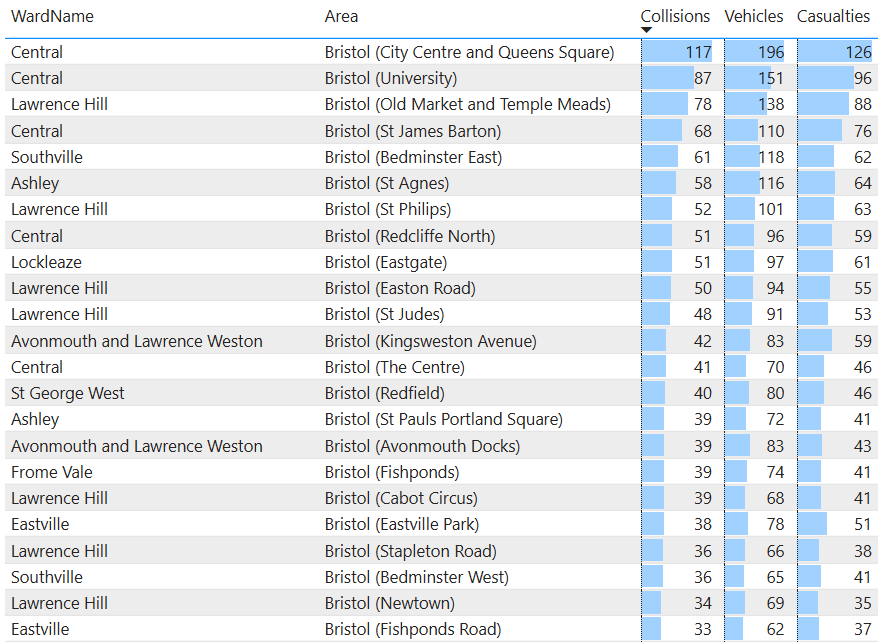
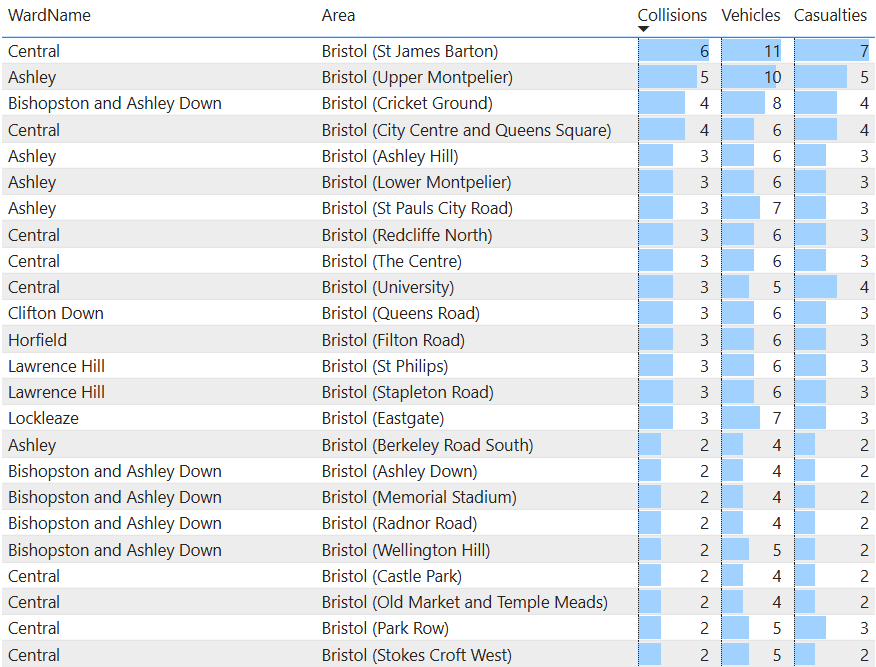
Bristol Areas with most collisions
EBLN Analysis
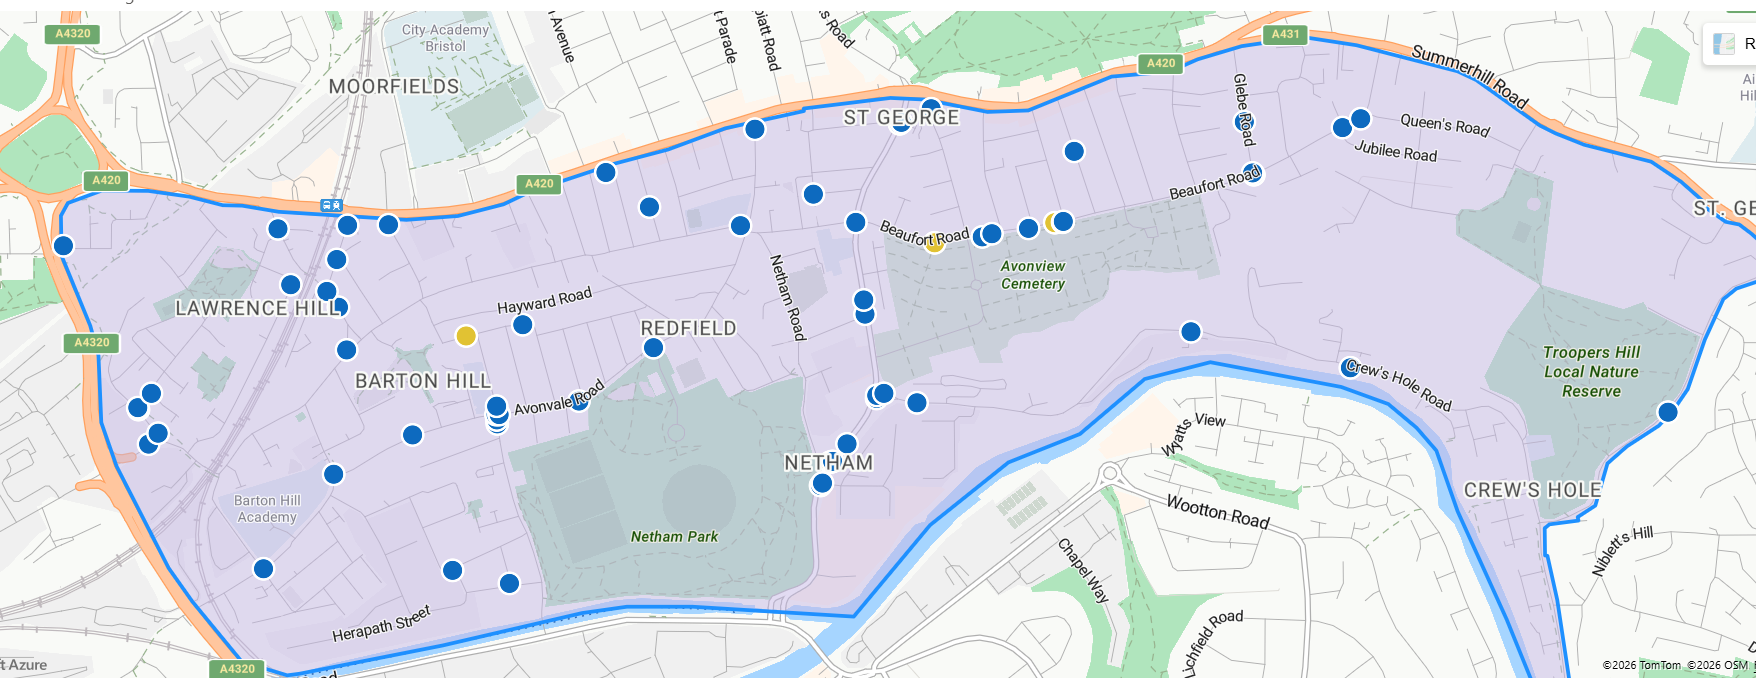
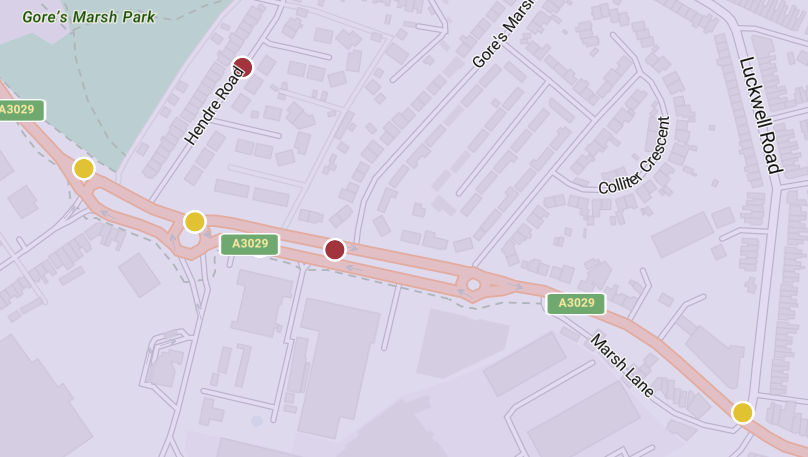
The STATS19 data shows that there have been 64 collisions in the EBLN area since January 2020.
Note that the 2025 data is provisional and does not include all collisions for 2025.
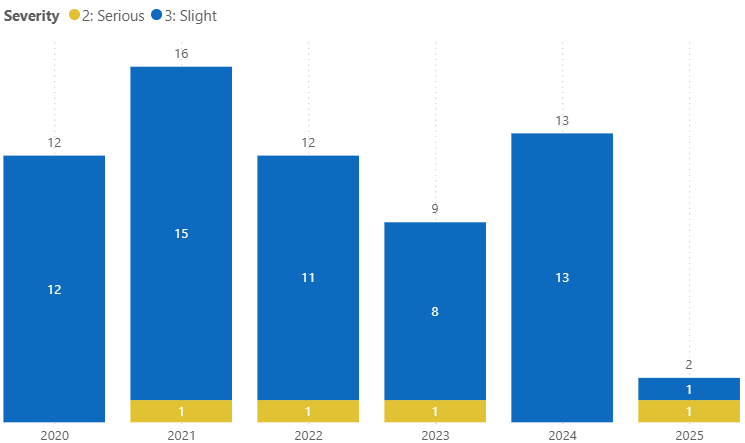
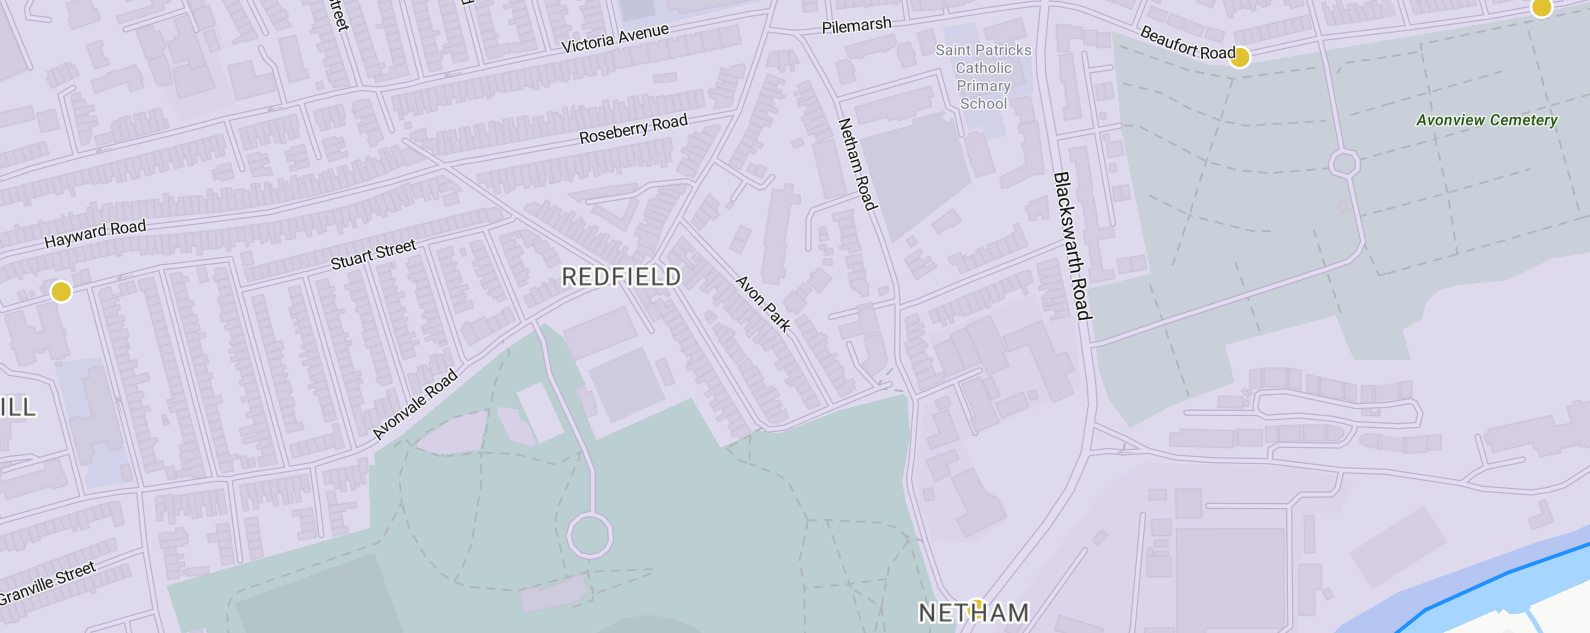
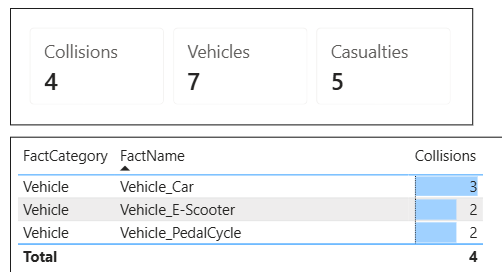
There were no "Fatal" collisions during this period, but there were 4 "Serious" collisions.
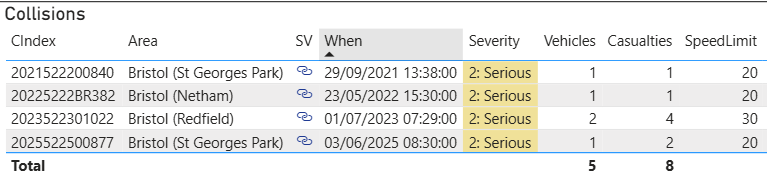
Which involved 5 vehicles:
And 8 casualties:
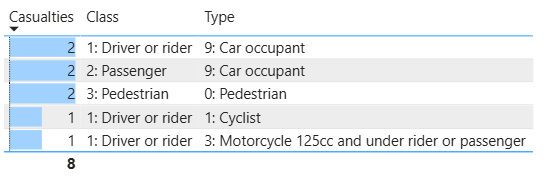
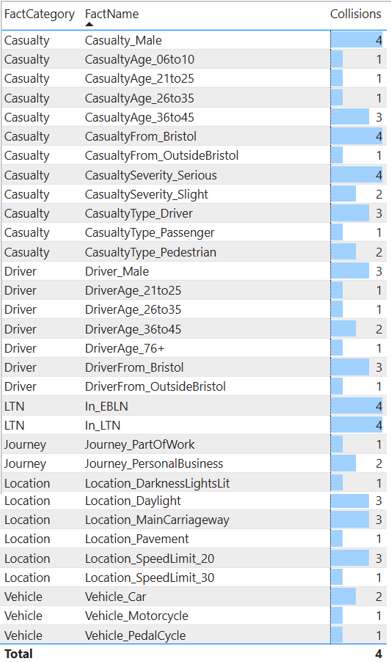
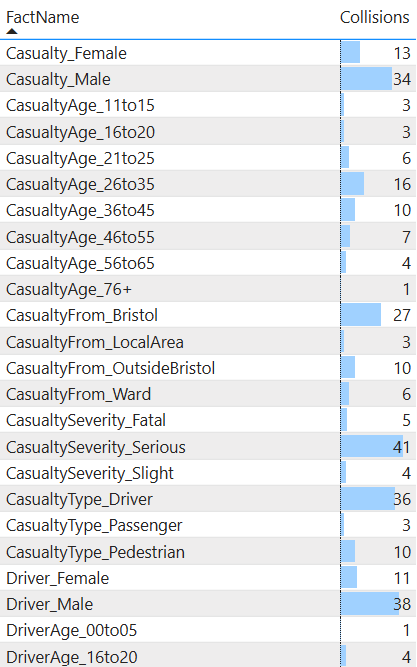
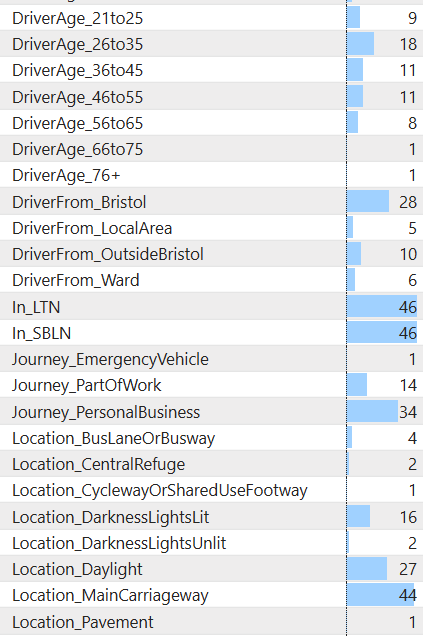
These are the "Facts" for these 4 collisions:
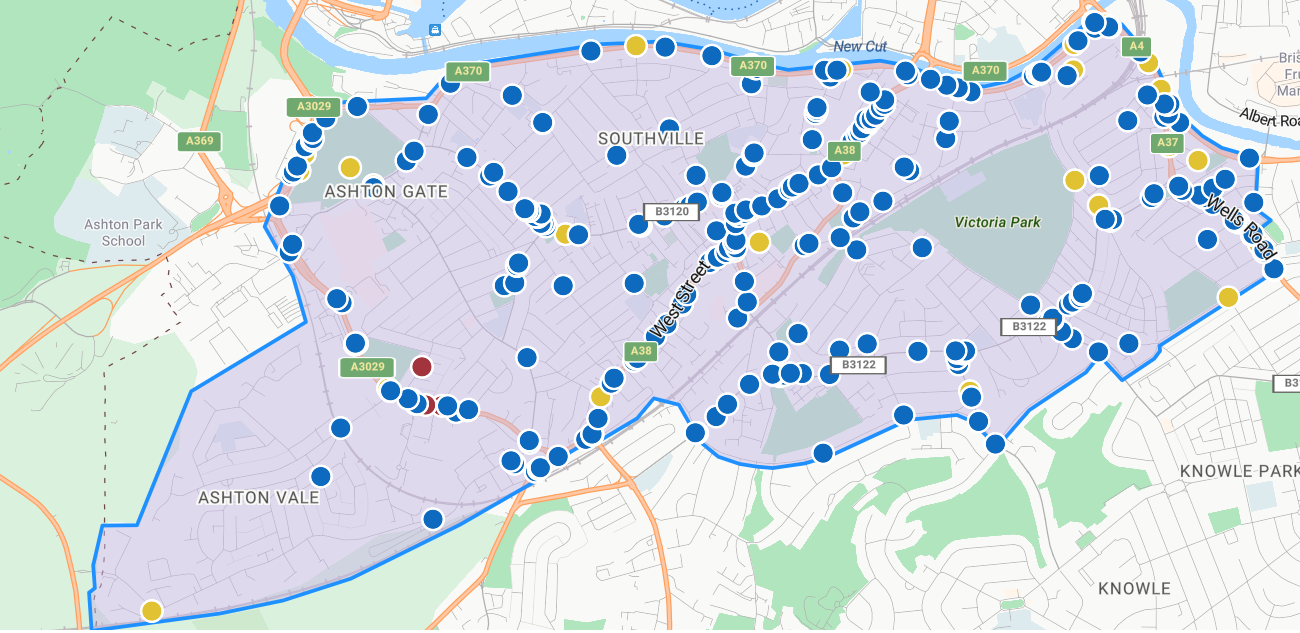
SBLN Analysis
The STATS19 data shows that there have been 323 collisions in the SBLN area since January 2020.
Note that the 2025 data is provisional and does not include all collisions for 2025.
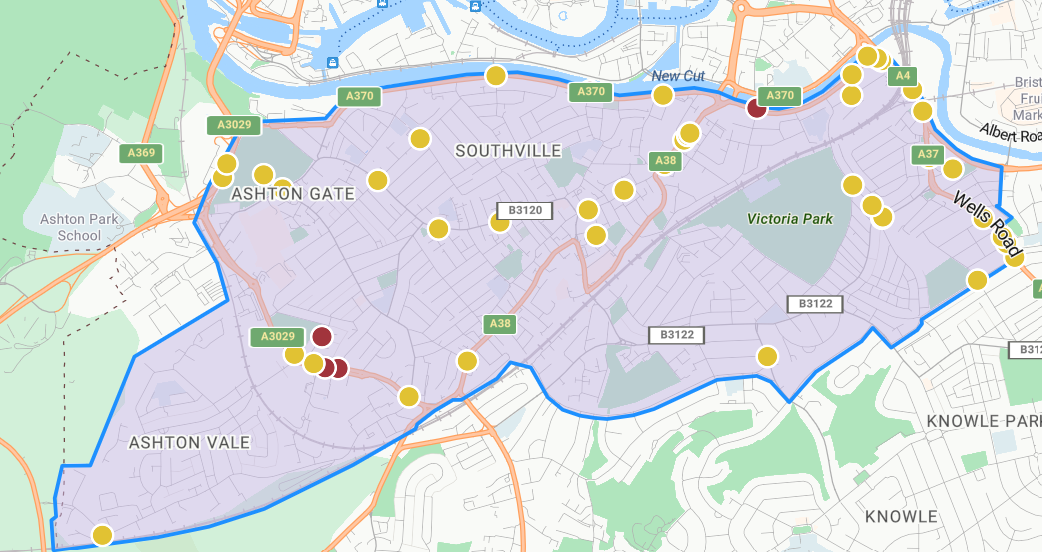
There were 5 "Fatal" collisions during this period, and 41 "Serious" collisions.
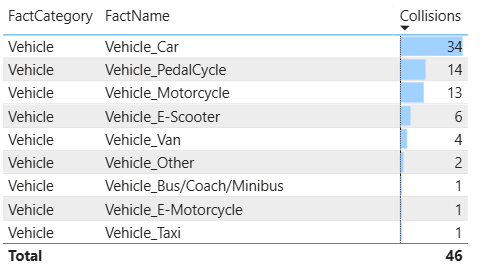
Which involved 81 vehicles. There are details for 46 of the vehicles.
And 53 casualties:
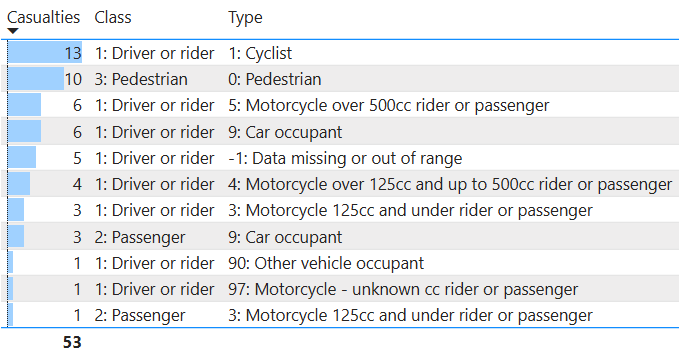
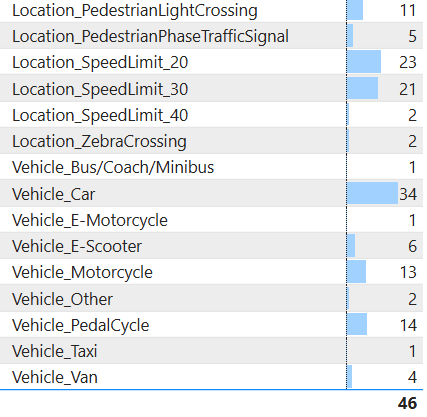
These are the "Facts" for these 46 collisions.
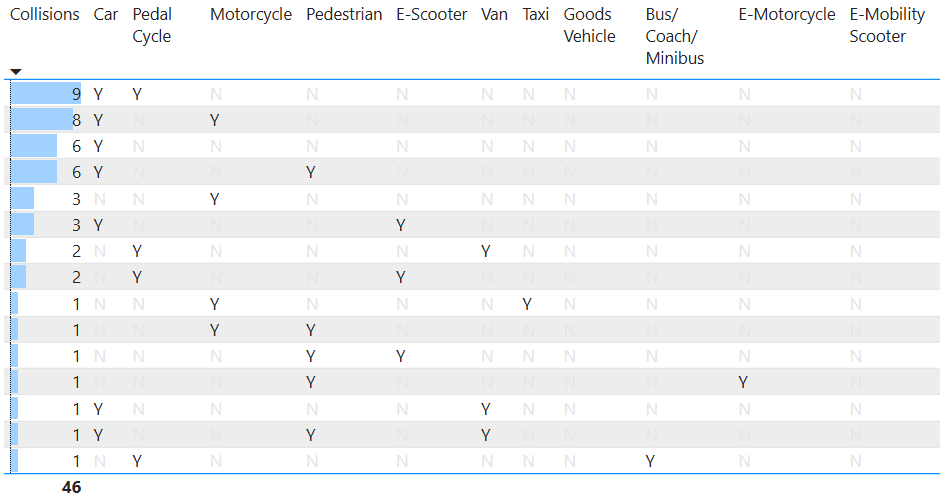
These are the "Combinations" for these 46 Fatal/Serious collisions:
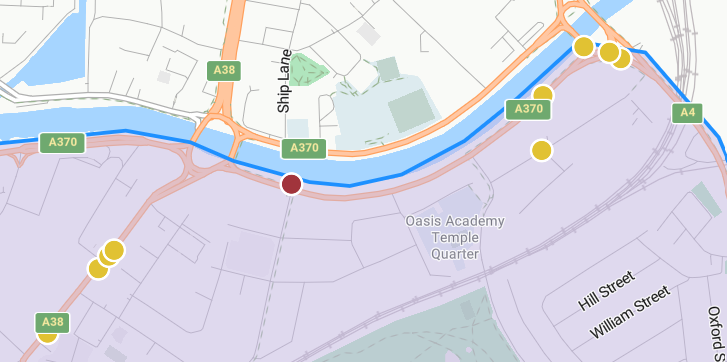
These are the local areas in the SBLN where these collisions occurred:
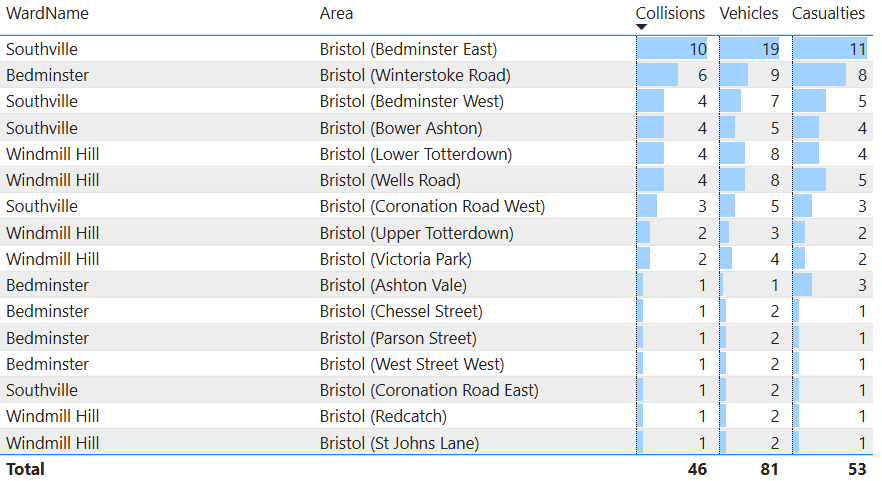
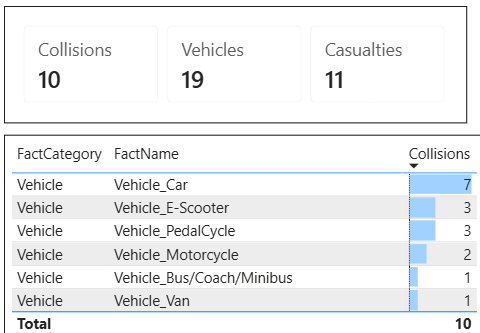
Bristol (Bedminster East)
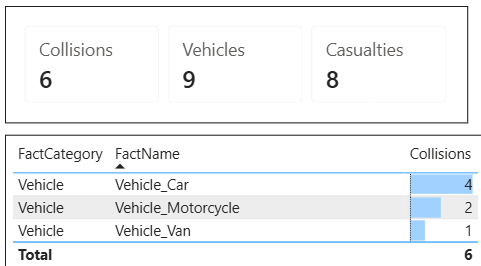
Bristol (Winterstoke Road)
Bristol (Bedminster West)
Bristol Insights
Make/Model of vehicles
Some of the collision data includes details on the make/model of the vehicles involved.
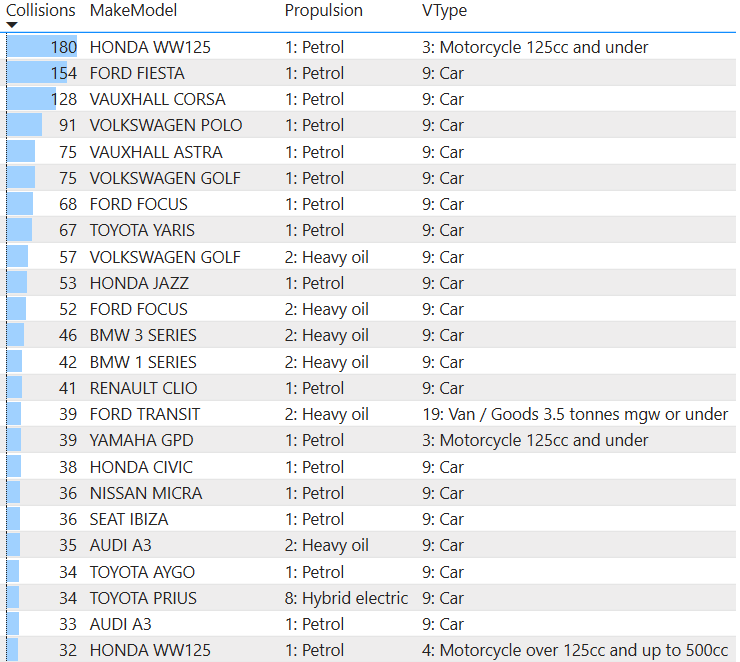
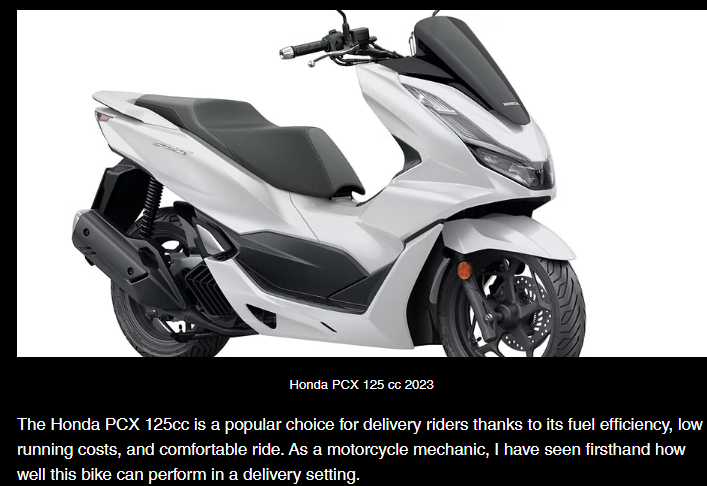
The Honda WW125 (commonly known as PCX125) is popular with delivery drivers. This is at the top of the Make/Model list for vehicles (where details are provided) involved in collisions, which implies that delivery drivers are involved in many collisions.
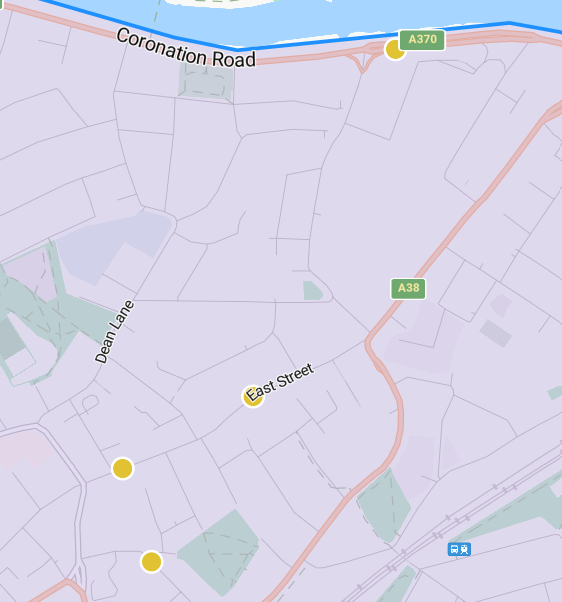
These are the locations where this vehicle was involved in collisions:
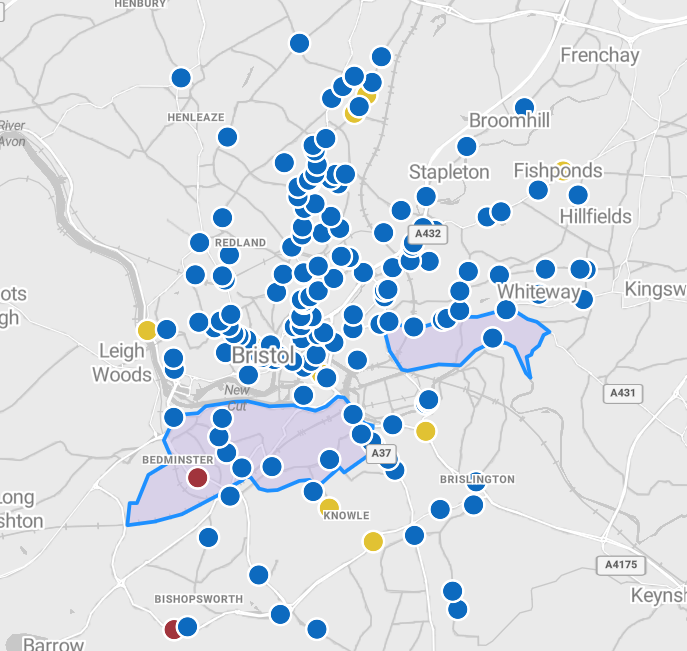
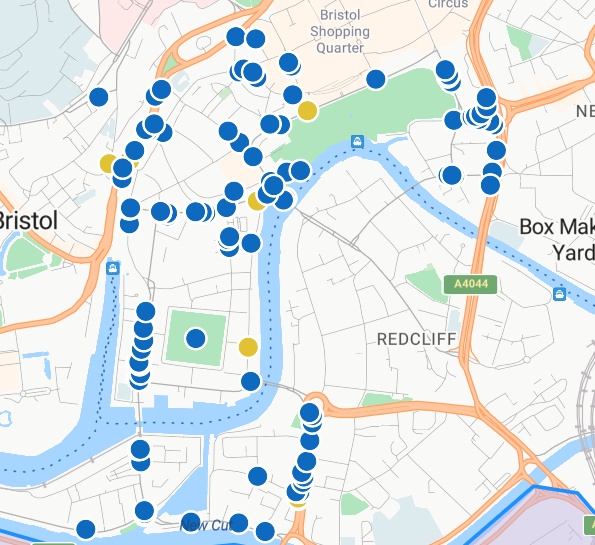
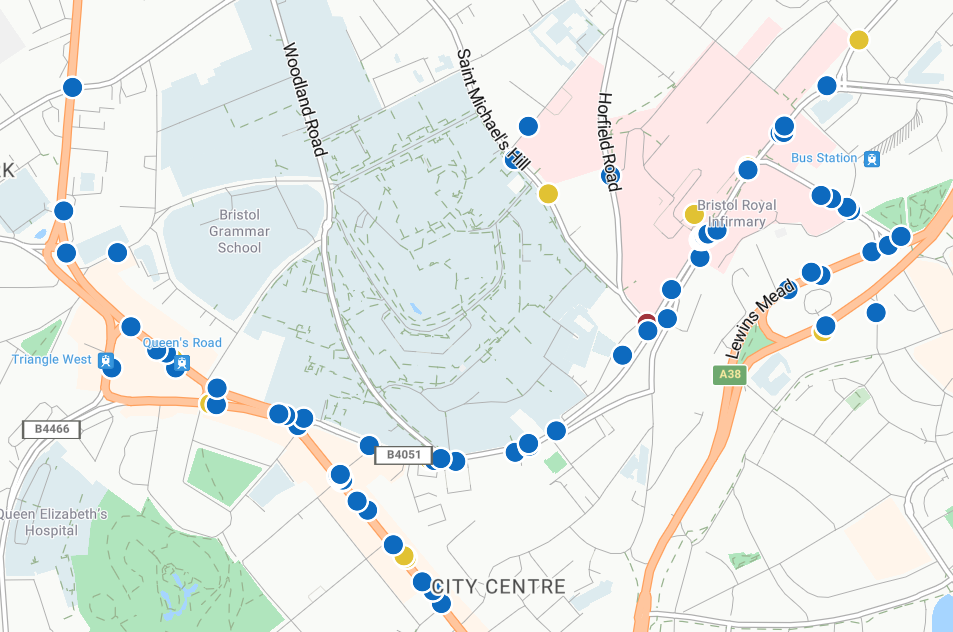
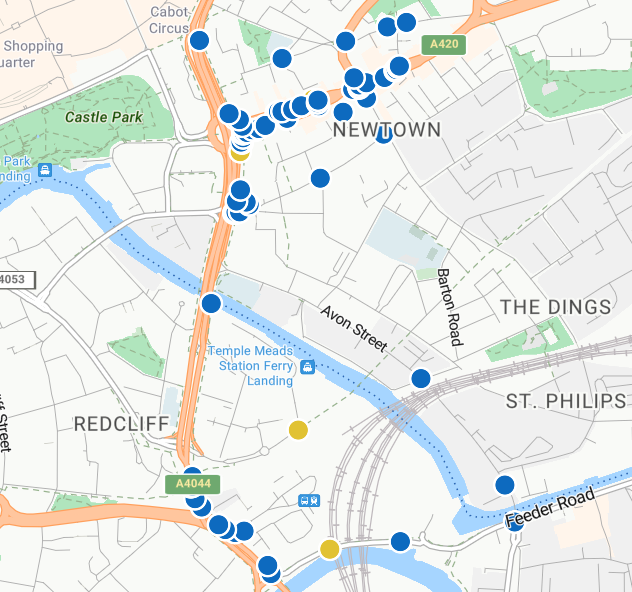
Top 3 Areas for collisions
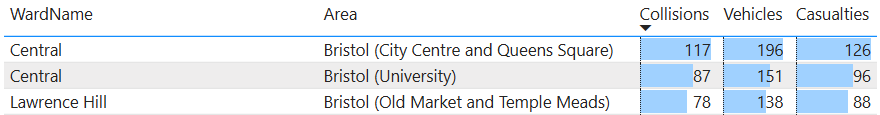
City Centre and Queens Square
Bristol (University)
Old Market and Temple Meads
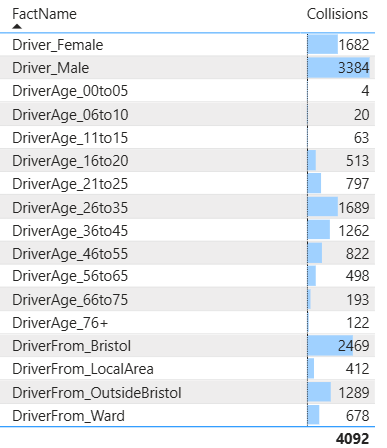
Drivers involved in collisions
- Twice as many males as females
- 26 to 35 is the most common age bracket
- 32% from outside of Bristol
- 10% from the local area
Vehicle Types
E-Scooter information has only been recorded since 2024, but they are already at number 5 in the chart, ahead of Taxi's and Goods Vehicles.
Most E-Scooter collisions involve Cars (198), but collisions with Pedestrians are 2nd at 41.
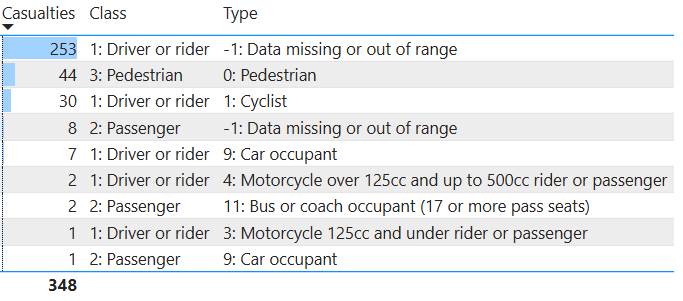
44 Pedestrians and 30 Cyclists were injured in collisions with E-Scooters.
Cyclists
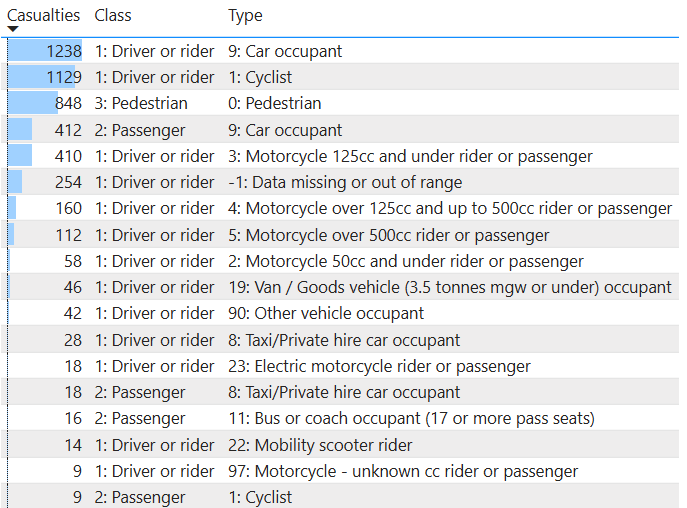
The 2nd highest class of casualties are Cyclists (1,129). This is higher than the number of Pedestrian casualties (848)
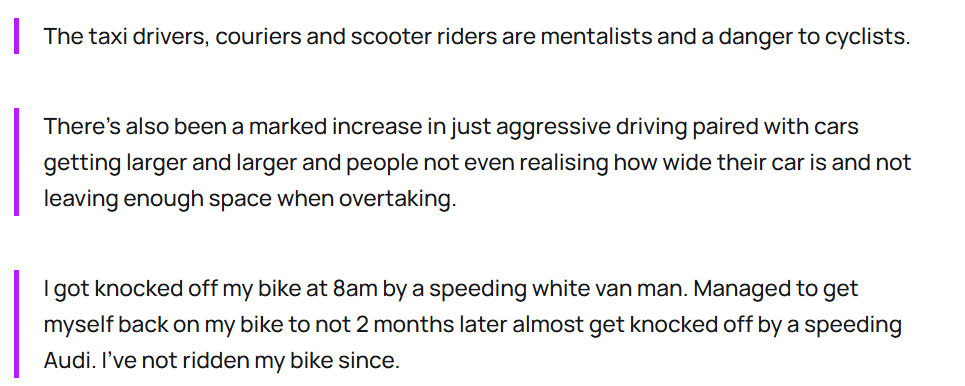
The danger to Cyclists is reflected in the comments reported in this article that called out the reduction in the number of people cycling regularly in Bristol.
Comments ()