
SBLN - Engagement Online Map Analysis (Part 1)
On 15/08/2025 Bristol City Council published a post on X:
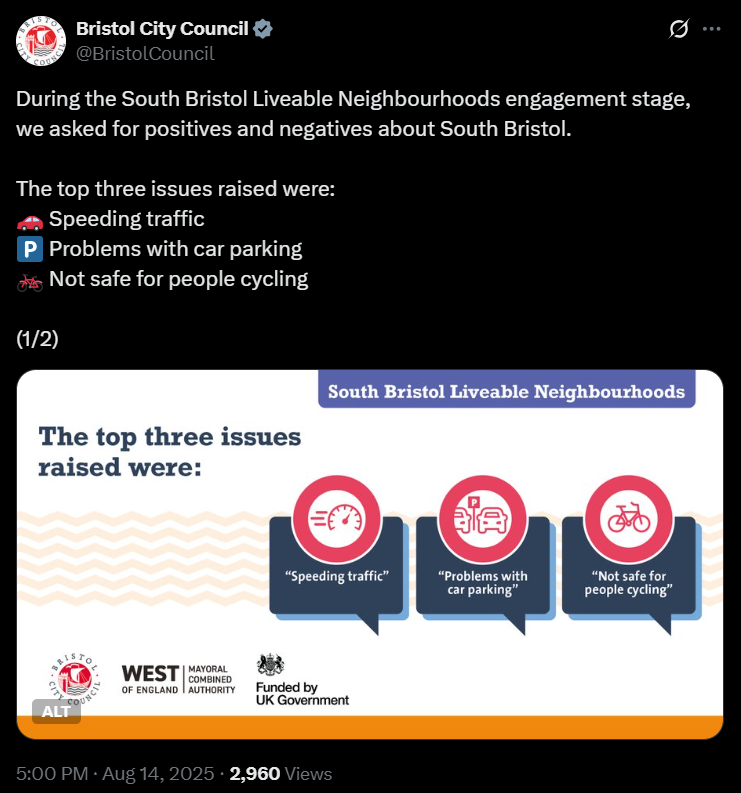
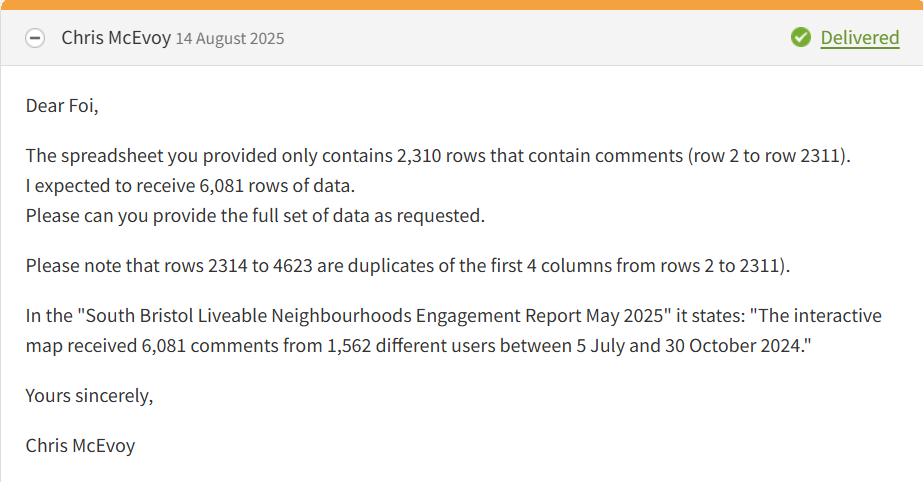
Suzanne Audrey responded to this post with:
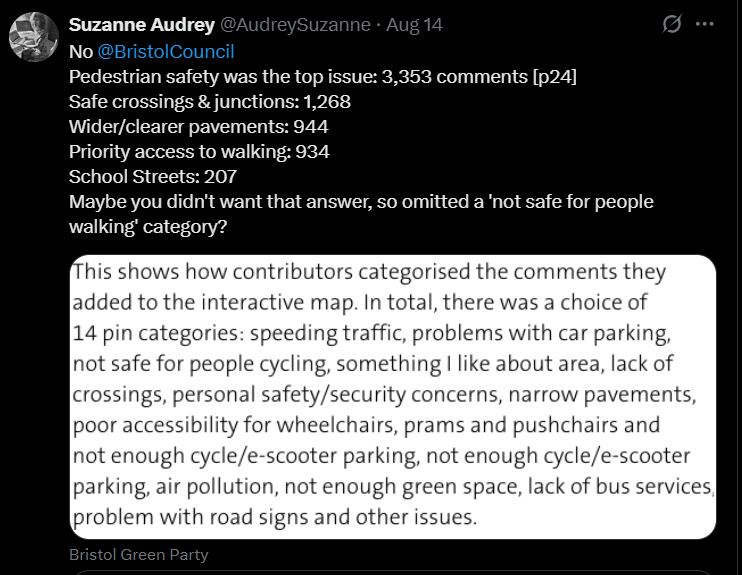
This comment refers to the Engagement Report (May 2025) which includes analysis of the responses received about the SBLN. This analysis includes some information about the 6,081 responses to the "Interactive Map" which was the main tool used for engagement.
The individual responses submitted were available for anyone to view, but these were removed sometime in June 2025.
I submitted a Freedom of Information request for the details of the responses on 05/06/2025. BCC provided a spreadsheet on 14/08/2025. But after initial analysis I found that the spreadsheet only contained 2,310 of the expected 6,081 records. I responded to BCC on the same day with a request to provide all of the data.
The Spreadsheet
The spreadsheet provided by BCC contained 2,310 (of the expected 6,081) responses contained 8 columns of information.
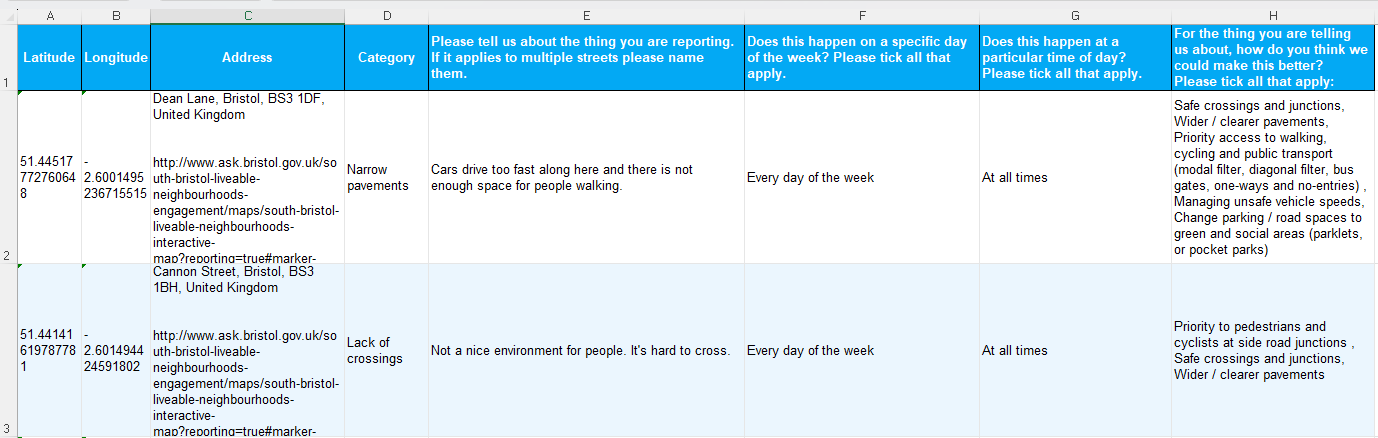
Latitude/Longitude
I have assumed that this is the location that was plotted on the interactive map. But I have found that not all of these locations appear on the map visual published in the engagement report. For example there is one location in Shirehampton which was not included.
Address
I have assumed this is the address of the location for which the comment was made. I have used the Post Code in this address to map to the Ward. Address also contains a URL which was the link to the entry on the interactive map which was removed by BCC and cannot be used.
Other Fields
I have not generated any extra data from these fields at this time.
My Analysis
Wards
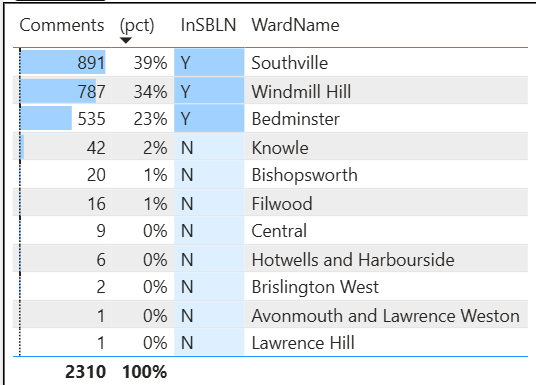
96% of comments submitted were related to Wards inside the SBLN.
It is valid for people outside of the SBLN zone to submit comments as they are likely to be impacted by any changes implemented.
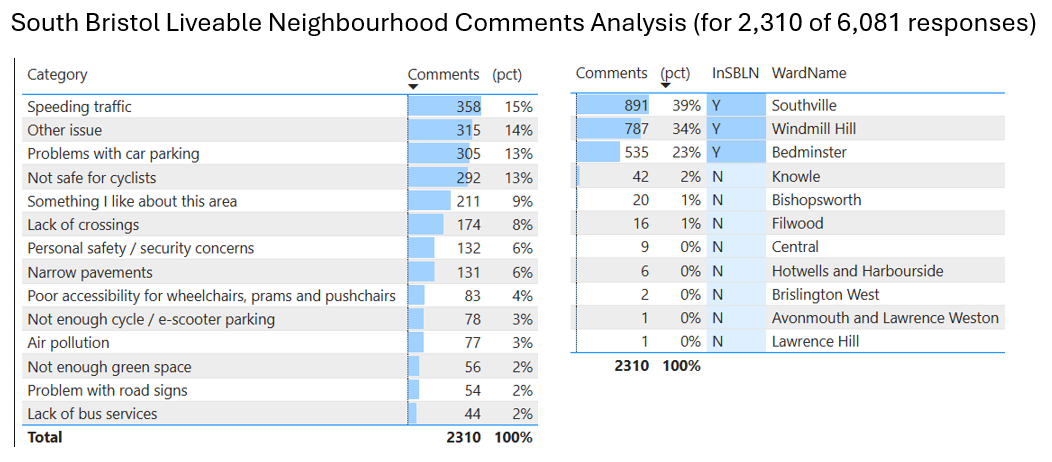
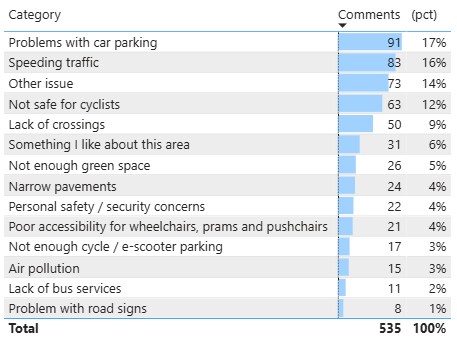
Categories
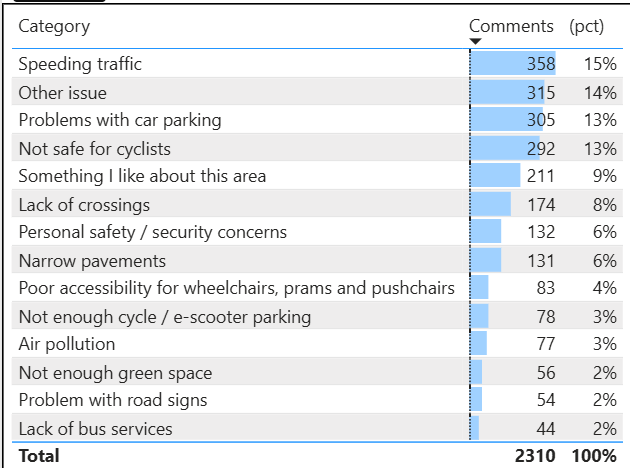
The Top 3 categories (excluding "Other Issue") are the same as the ones published in the BCC X Post. Please note that these categories do not match the categorisation model in the Engagement Report (page 24) and therefore it is not possible for me to map individual responses to their model.
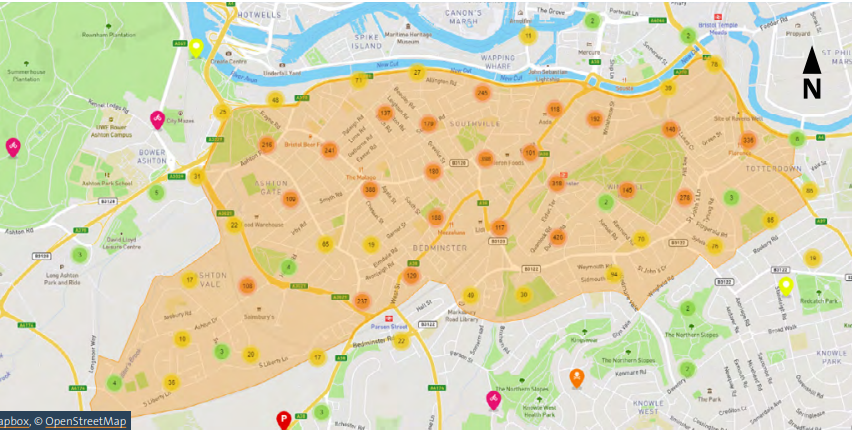
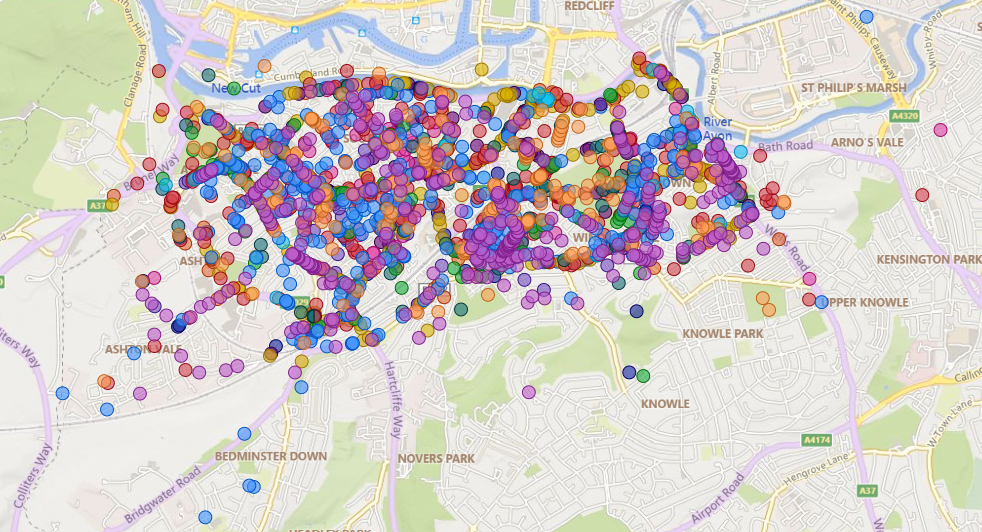
Locations
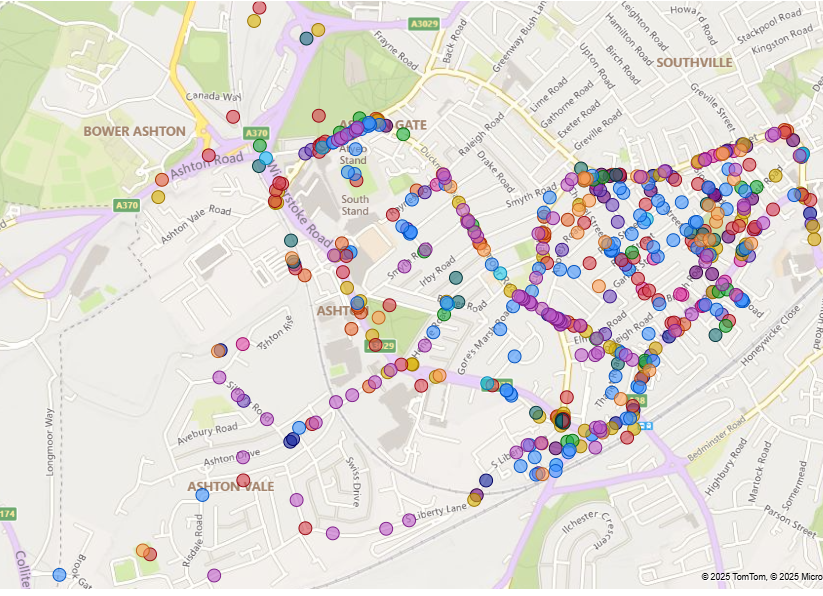
These are the locations for the data I was given. I have excluded the one in Shirehampton from this view to provide a more concise view. The colours relate to the category of the comment. Please note that I have generated the mappings to Wards, so any errors in Ward mappings are mine and not BCCs.
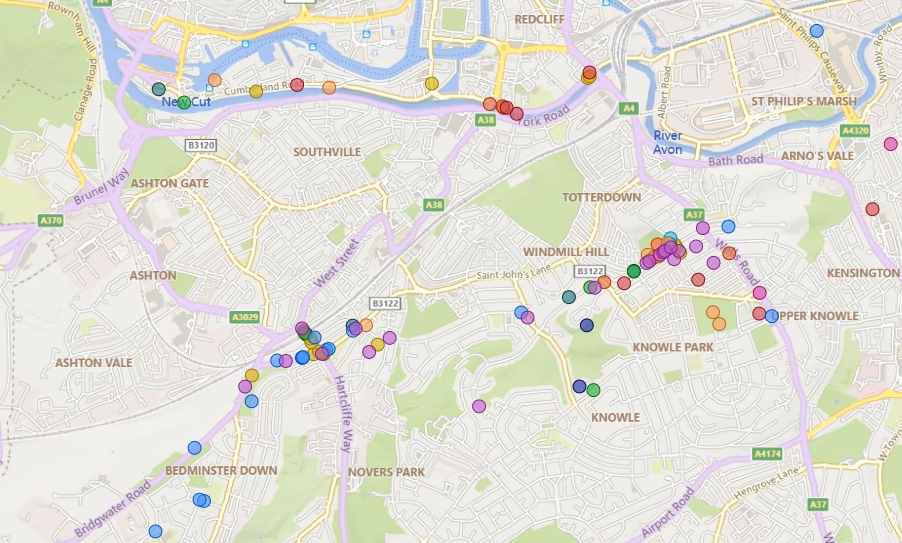
These are the locations that are outside of the SBLN Zone (excluding the Shirehampton one).
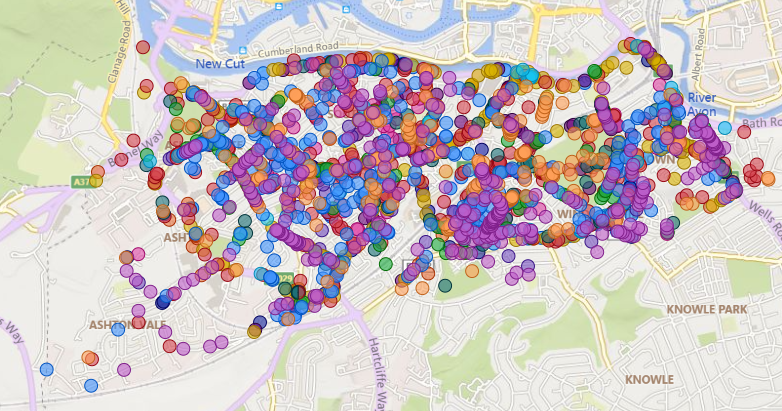
And these are the locations inside the SBLN Zone.
Southville
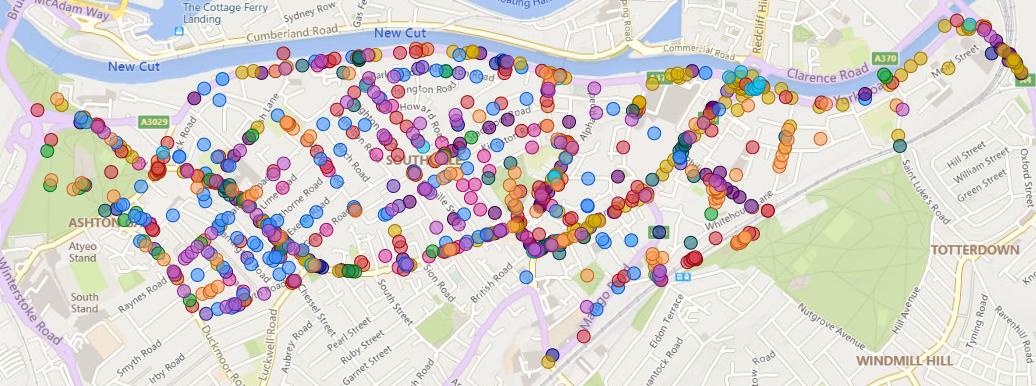
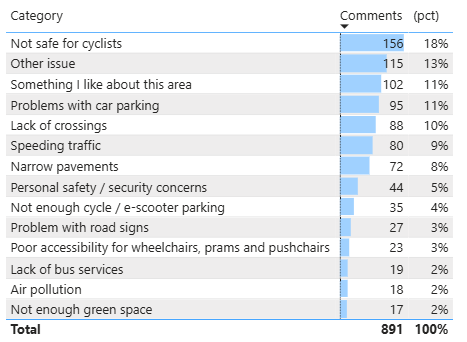
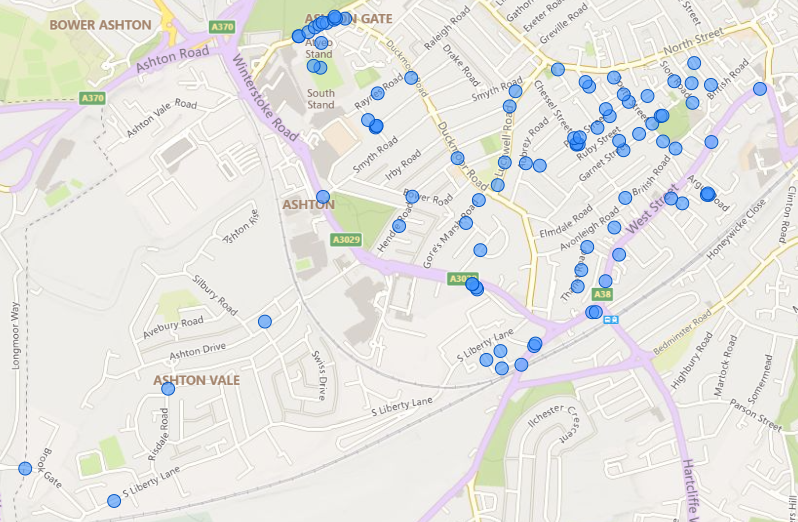
Map for Southville - "Not safe for cyclists":
Windmill Hill
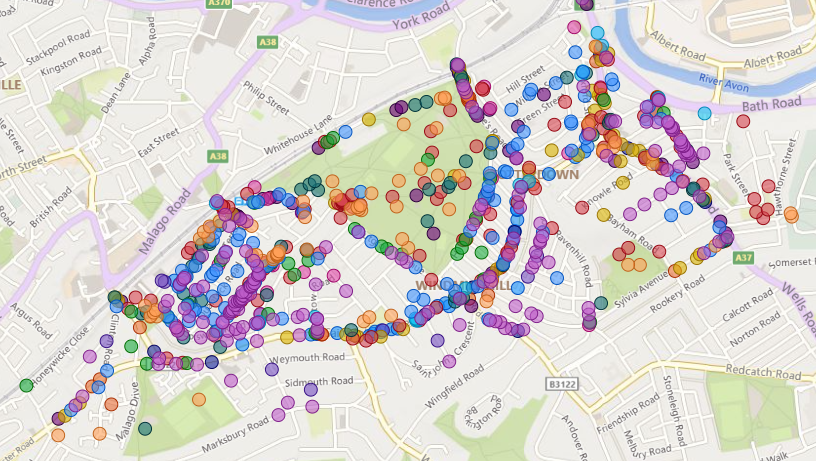
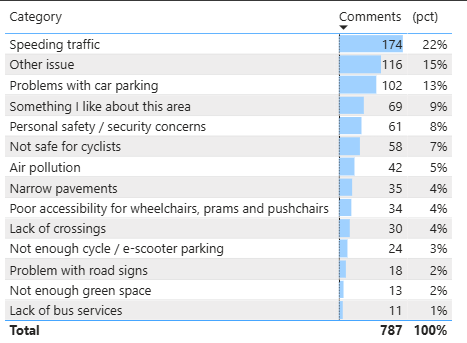
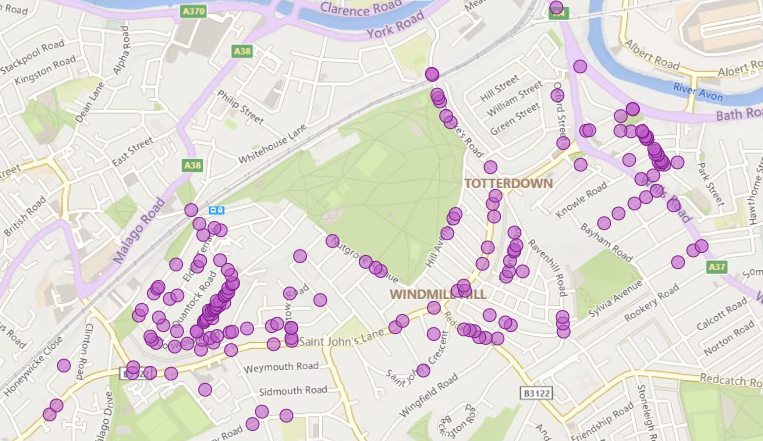
Map for Windmill Hill - "Speeding Traffic":
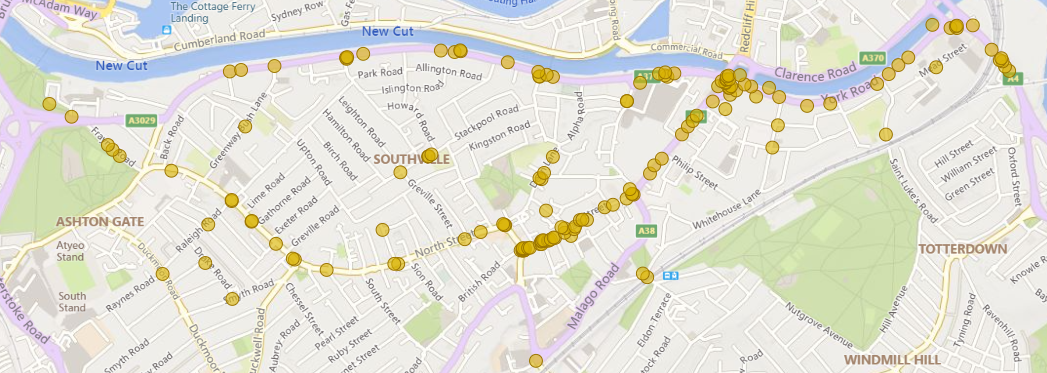
Bedminster
Map for Bedminster - "Problems with car parking":
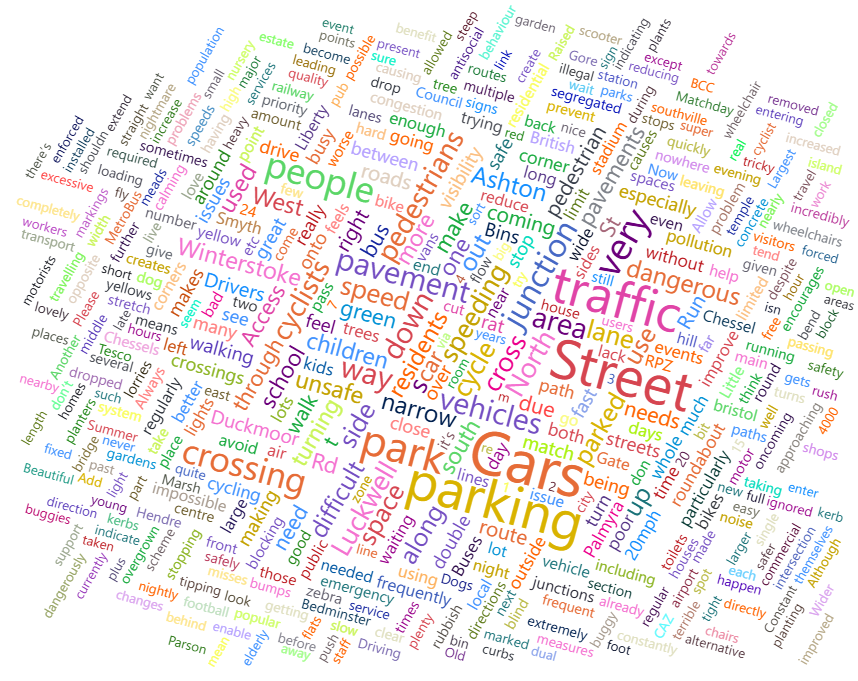
Word Cloud
These are the word clouds for the comments received data. Common words have been removed.
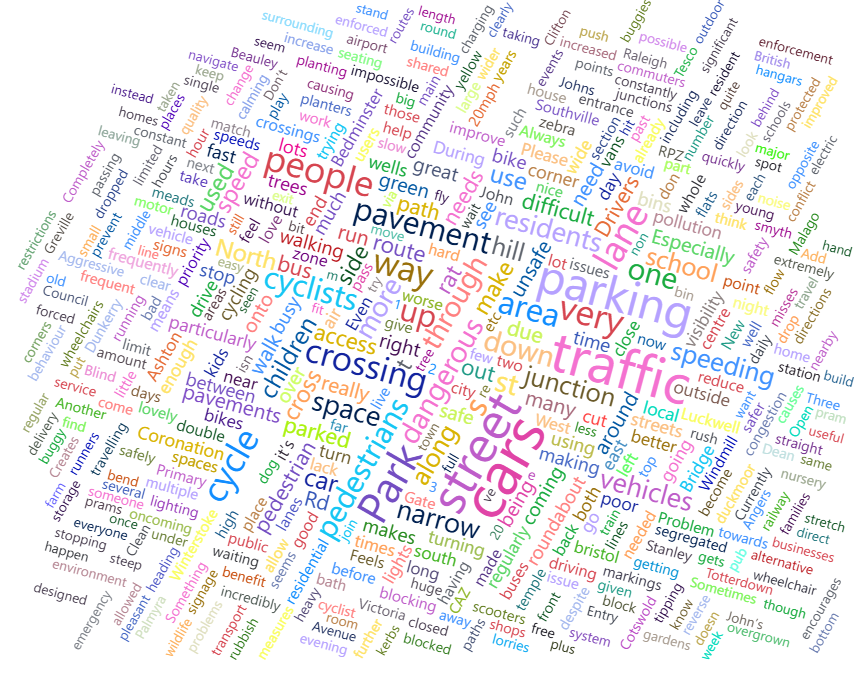
Southville
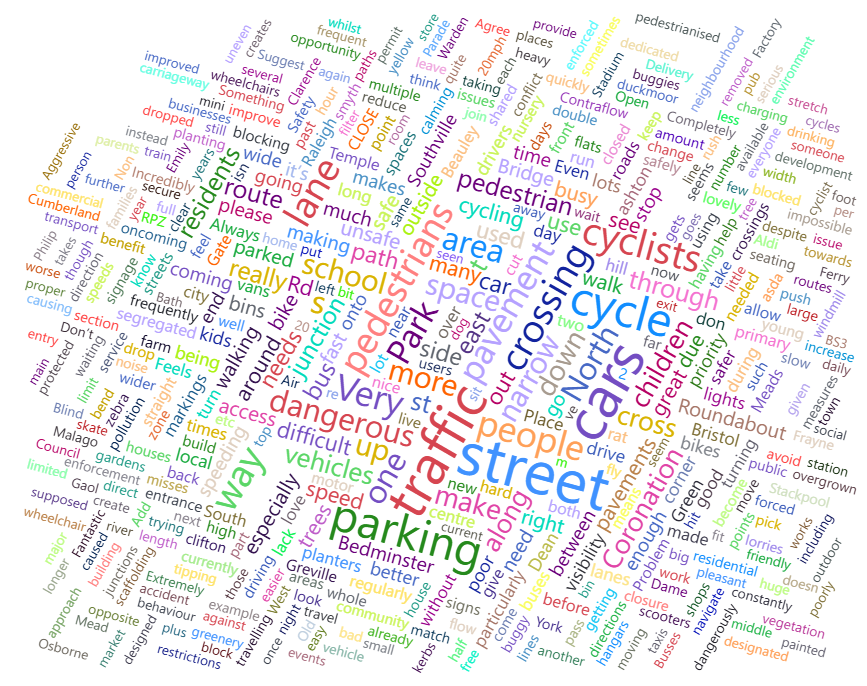
Windmill Hill
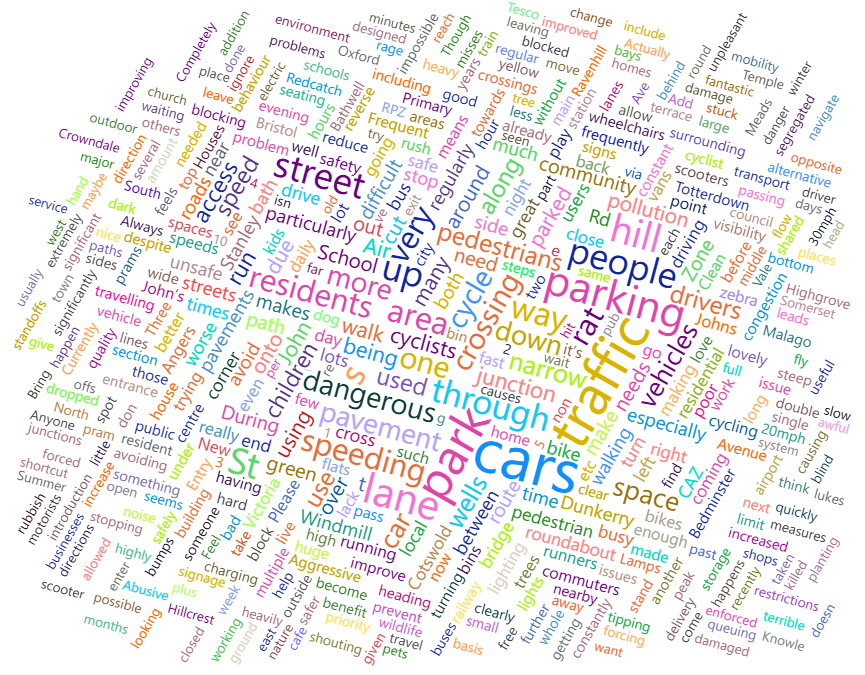
Bedminster
Individual Comments
You can see all the details for the comments on my report.
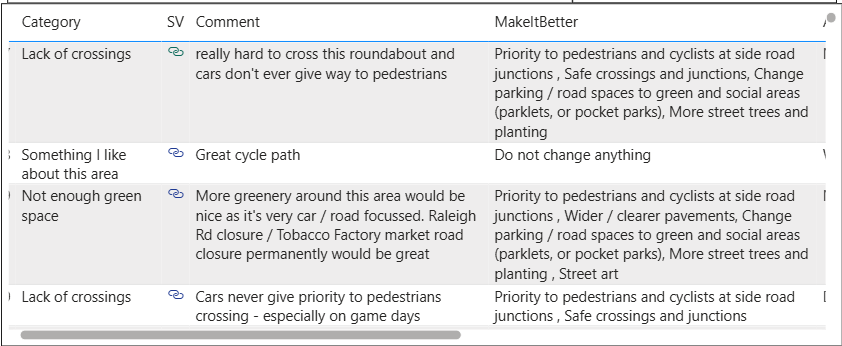
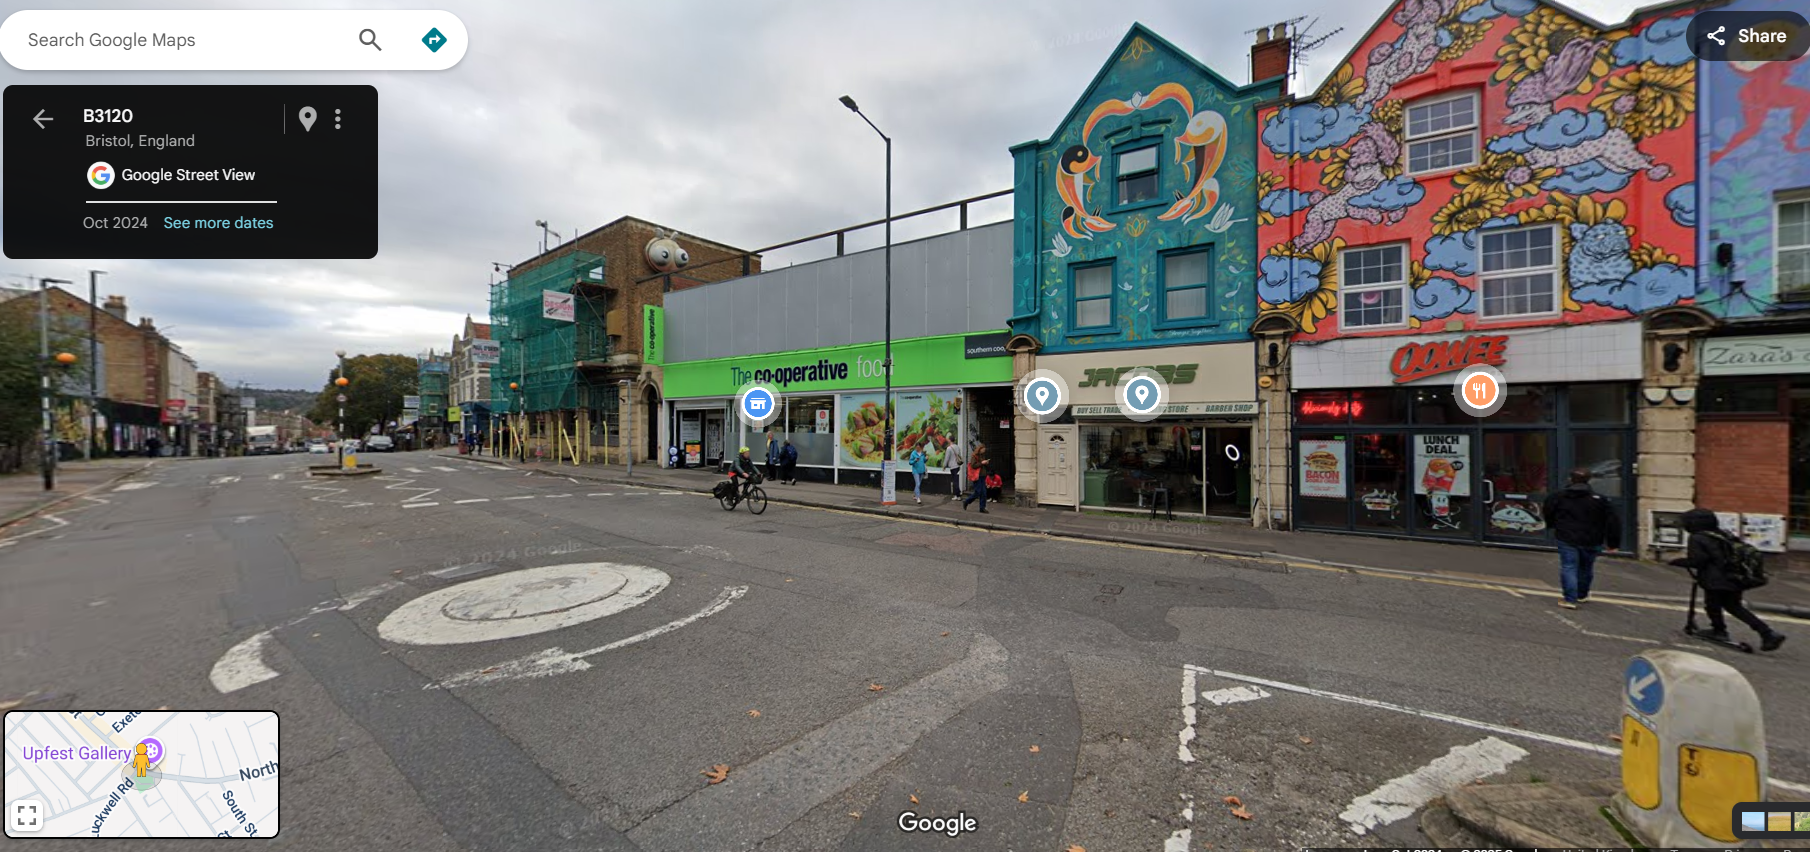
You can also click on the "SV" icon to see the Google Street View location. For example, this is the "Street View" for the first comment in the table above "Lack of crossings":
Comments ()