
East Bristol Liveable Neighbourhood - How many Cars, Taxis, E-Scooters or Pedestrians?
The Monitoring Strategy for the EBLN was published in September 2025.
I would have expected this to be published in the "Bristol Documents Library", but instead it was published on the Survey Site used by BCC at https://files.smartsurvey.io/3/0/7JLPT0FJ/EBLN_Monitoring_Strategy_(September_2025. This is not a recognised repository of formal BCC documents.
The Bristol Documents Library is very difficult to use as it does not allow you to easily see recently added documents. This is why I built a document report that allows you to navigate the documents much more easily. But if they don't publish their documents in the library then it is even more difficult to find them.
The EBLN Monitoring Strategy itself contains some very useful information.
Extensive area wide data collection was carried out before the start of the East Bristol Liveable Neighbourhood project to understand the transport demand and problems for both active travel and car journeys. This data was collected in March 2022 and included junction turning counts, automated traffic counts, ANPR surveys, and walking and cycling counts.
Since February 2024, we have been collecting live data on traffic levels within the scheme area and on immediate boundary roads. This data is complemented by the traffic data we hold on our main roads, such as Church Road.
The Monitoring Strategy also states:
We will publish review reports, supporting data and equality impact assessments on our online consultation platform at www.bristol.gov.uk/eastbristolliveableneighbourhood
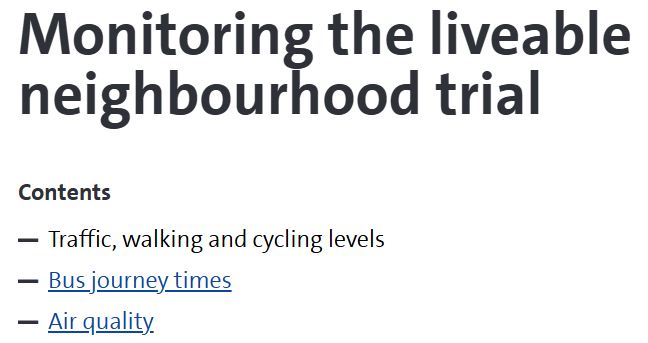
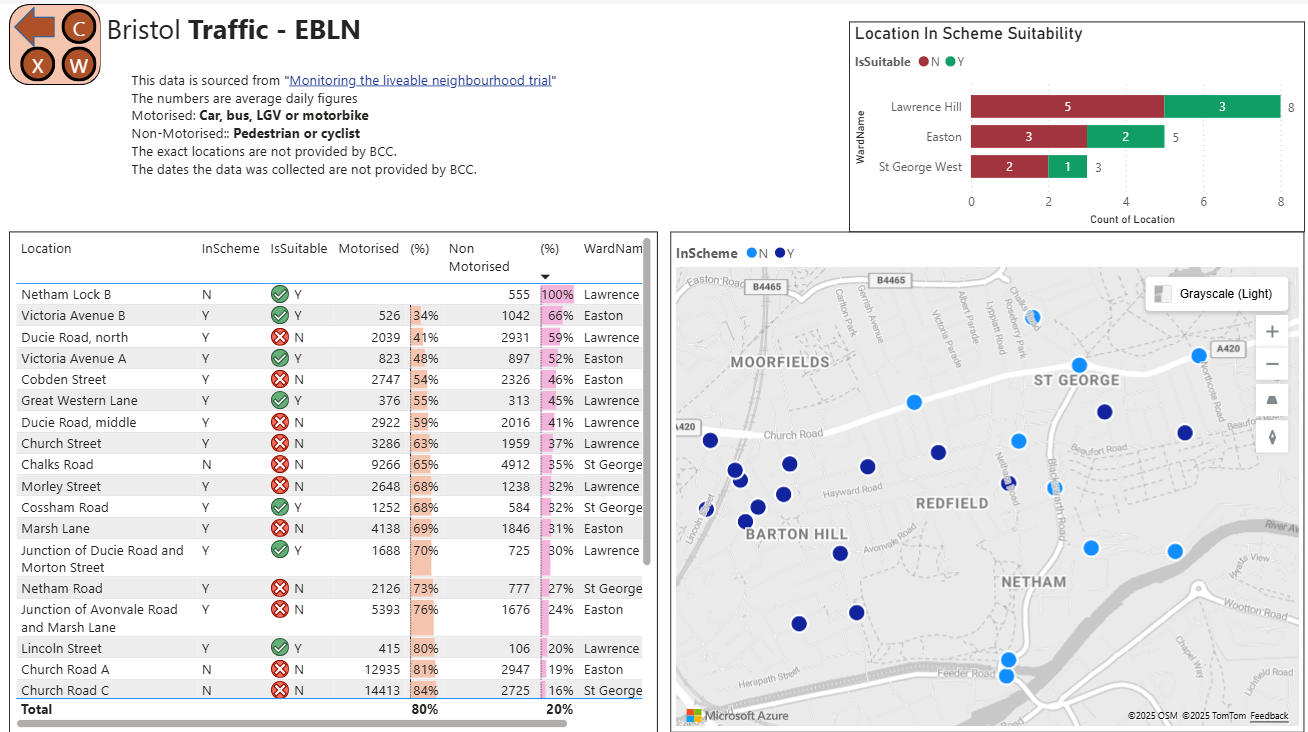
There is just one page that has just been published that does contains some monitoring data (Monitoring the liveable neighbourhood trial).
The document contains some monitoring data from locations inside and adjacent to the scheme area. The number shows the average number of vehicles a day at each site.
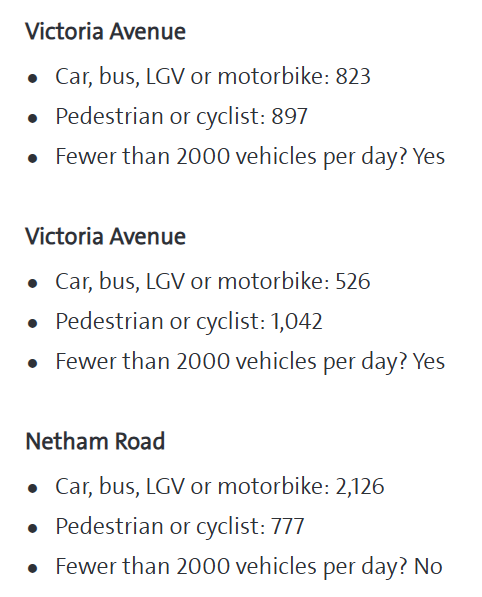
There is a lot of detail missing from these published summaries of the monitoring data:
Why aren't the individual numbers shows for each category?
There is a lot of difference between a Pedestrian and a Cyclist. Also between a Bus and a Motorcycle. Are e-Scooters included in this category? Why aren't Taxis shown separately?
Where are the Locations?
There are multiple entries for the same location (e.g. two for "Church Road"). The specific location (Lat, Lon) should be provided for each monitoring location.
What does "Fewer than 2000 vehicles a day" mean?
The latest Government guidance states that roads with fewer than 2000 vehicles per day are suitable and safe for active travel.
This implies that any location with 2000 or more average daily vehicle counts are not suitable for "active travel" improvements.
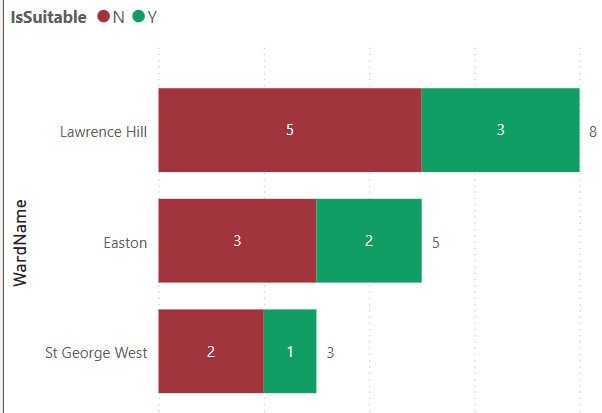
What does this mean for the 10 of the 16 monitoring locations that are "not suitable and safe for active travel improvements"?
It you look at the "latest government guidance" referenced by BCC, you will see that it is a "Cycle Infrastructure Design", where the only reference to "fewer than 2000" is here:
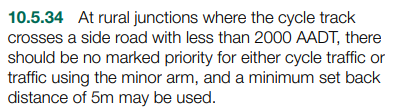
I don't believe there are any "rural junctions" in the EBLN Area, so why is this relevant?
Bristol Uncovered EBLN Monitoring Report
I have taken the data (manually typed it into a database) from the BCC Monitoring Page, and built a report that allows you to explore the data for yourself. I have had to estimate the exact locations of the monitoring sites. You can find the report on BU Reports (look for the Traffic button).
If BCC publish all of their monitoring data, then I can build a much better report.
The publication of the EBLN Monitoring Strategy is too little, too late for the implementation of the EBLN Trial, but if all of the monitoring data is published then at least BCC can be more transparent about the data that has (or has not) been used in the design and implementation of the EBLN Trial and might help people understand the real impact of the scheme.
Comments ()