Bristol Privilege Index 2025
The Office for National Statistics have just published the data for the "English indices of deprivation 2025".
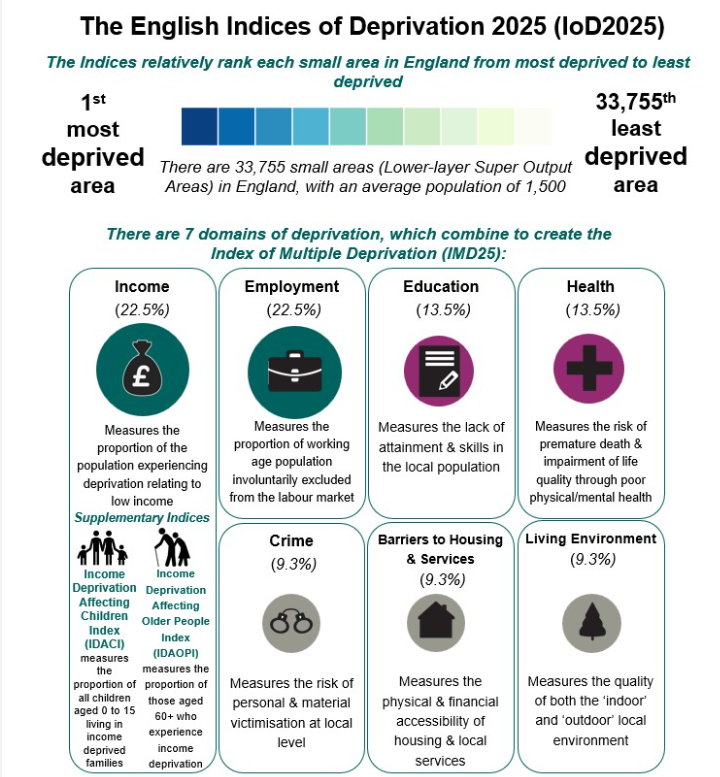
But rather than concentrate on the discussion in terms of "most deprived", it might also be useful to also look at the data in terms of "most privileged".
So I have turned these figures upside down and turned them into the "Bristol Privilege Index" (BPI). This data shows the areas in Bristol where people have the highest level of "privilege".

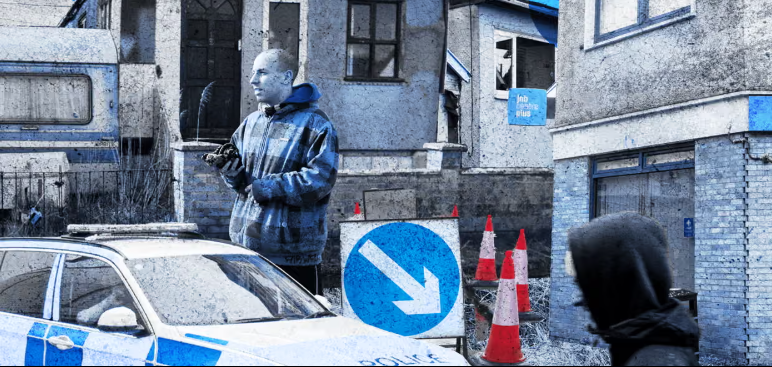
If you prefer the traditional approach of looking at this data, then you can always visit the Guardians "poverty porn" version at "How deprived is your area?"
There are two numbers you need to understand to make sense of the reports.
Index
This number shows the "percentile" that the area is in. An area with a score of 10 is in the top 10% of Privilege in Bristol and and area with a score of 1 is in the bottom 10% of Privilege in Bristol
Rank
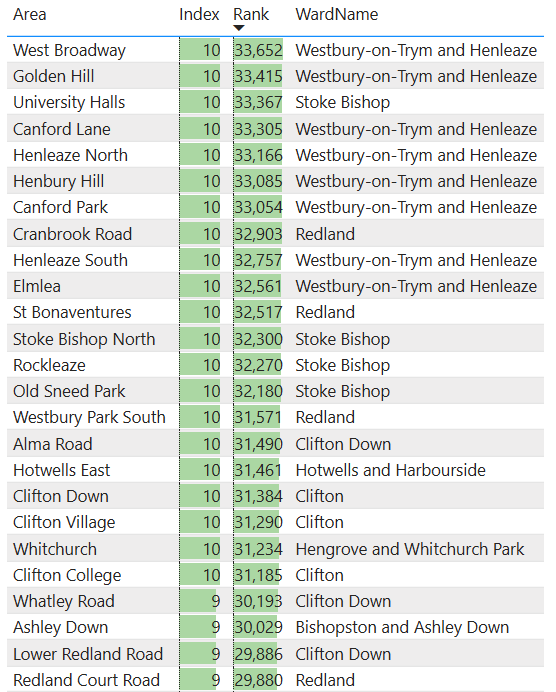
This number is where the area ranks in England for each measure. There are 33,755 areas in the full report, of which 268 are in Bristol. The means an Area with a Rank of 33,652 (e.g. West Broadway) is in the top tier of Privilege in England.
Bristol Privilege
The award for most privileged area in Bristol goes to West Broadway in the Westbury-on-Trym and Henleaze Ward. The 2nd most privileged area is Golden Hill, which is an appropriate name.
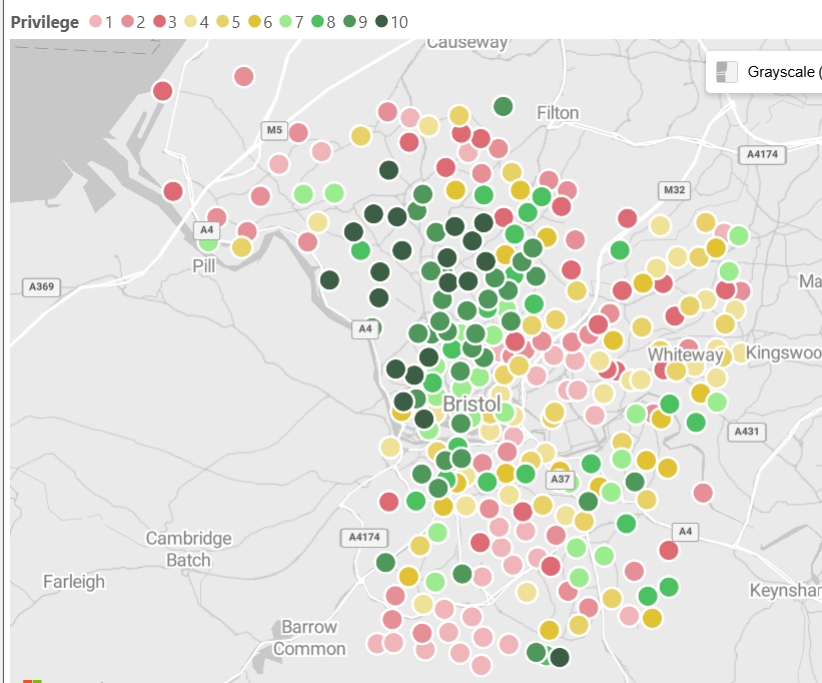
Map of Bristol Privilege
Areas with an Index of 10 are the most privileged.
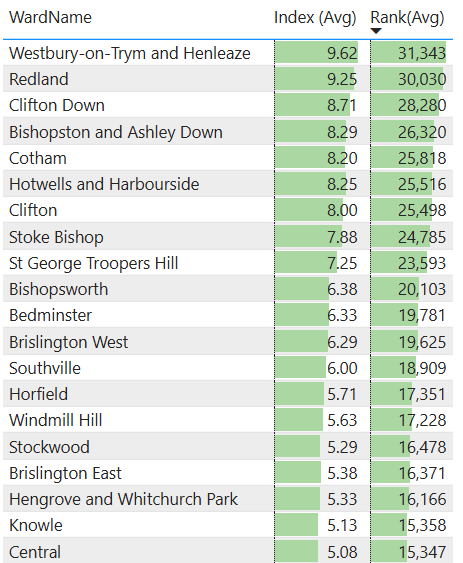
Wards of Privilege
These are the 20 most privileged Wards in Bristol.
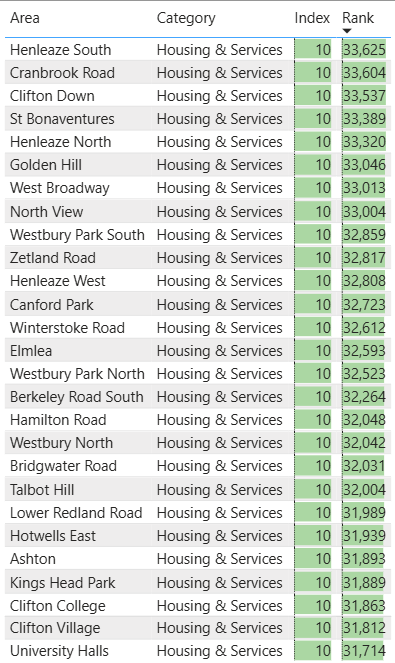
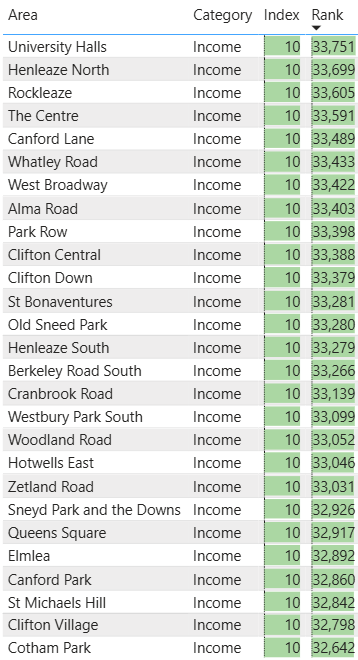
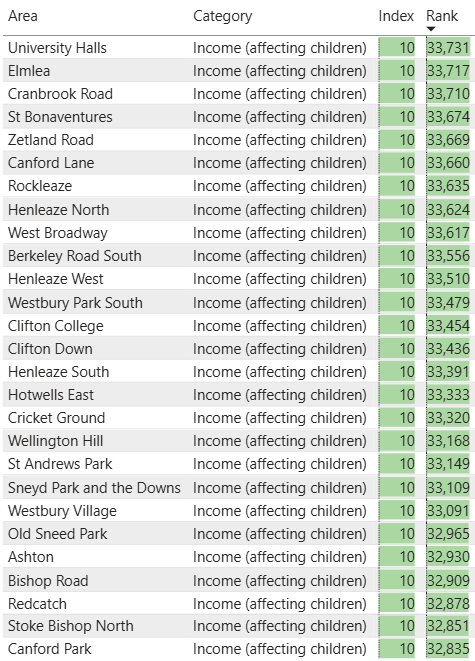
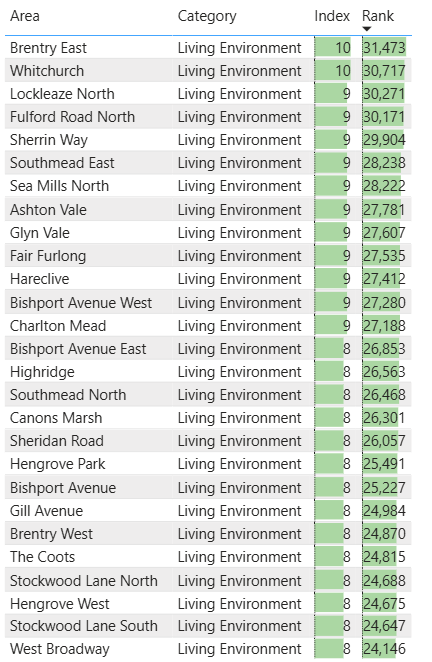
Areas of Privilege
These are top 25 most privileged Areas in Bristol.
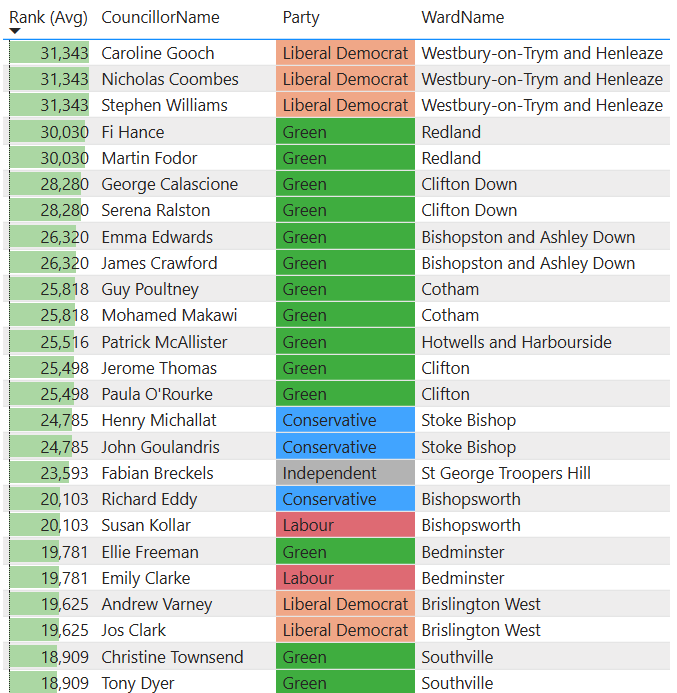
Councillors for Privilege
These are the top 25 Councillors who represent the most privileged Wards.
It appears that the Liberal Democrats and the Greens are the main "Parties of Privilege" in Bristol.
Categories of Privilege
There are 9 Categories of Privilege used in the analysis.
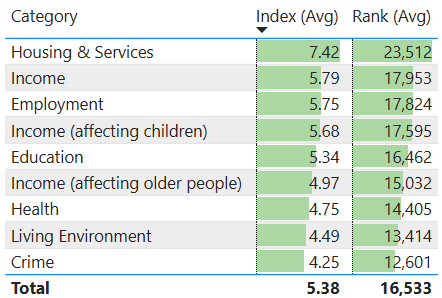
Housing & Services
Measures the physical and financial accessibility of housing and local services.
Income
Measures the proportion of the population experiencing privilege due to high income.
Income (affecting children)
Measures the proportion of all children aged 0 to 15 living in income rich families.
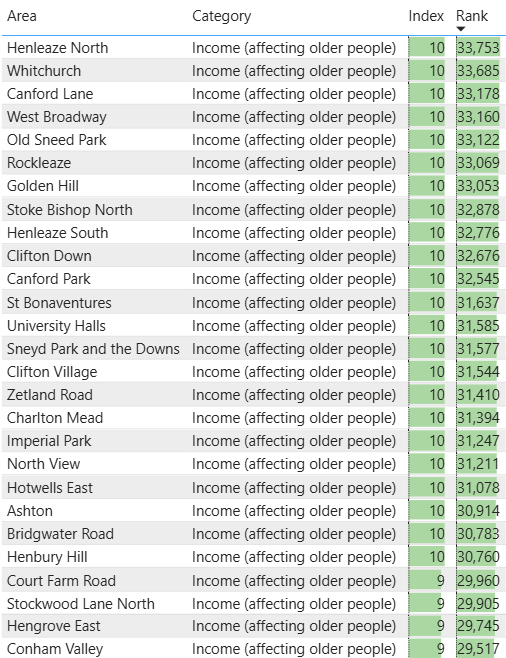
Income (affecting older people)
Measures the proportion of those aged 60+ who have privileged levels of income.
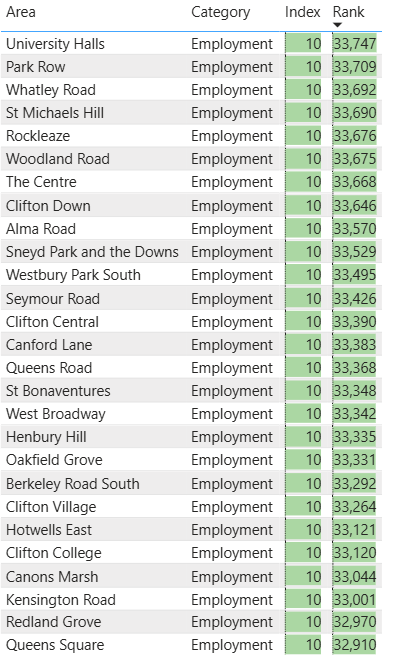
Employment
Measures the proportion of working age population with the most privileged access to the labour market.
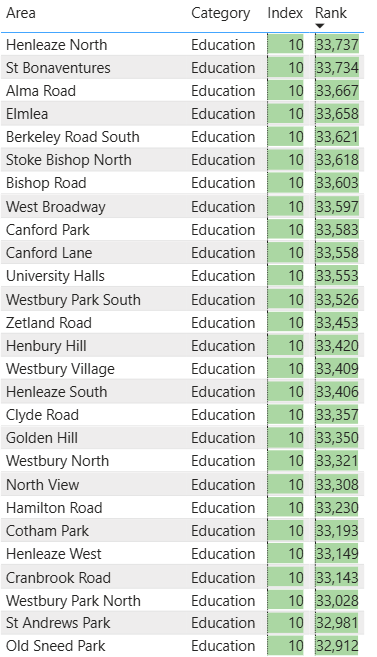
Education
Measures the high levels of attainment and skills in the local population.
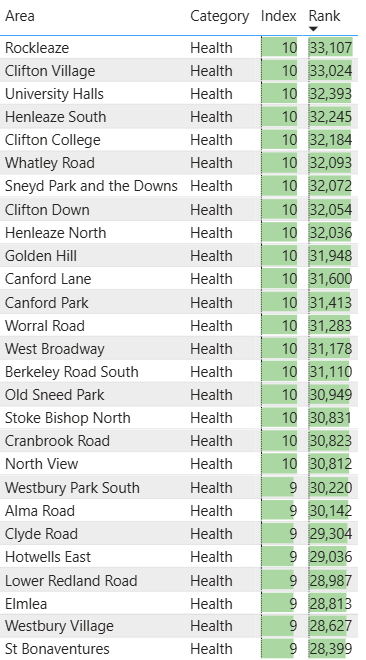
Health
Measures the probability of an extended life death and enhancement of life quality through good physical/mental health.
Living Environment
Measures the quality of both the ‘indoor’ and ‘outdoor’ local environment.
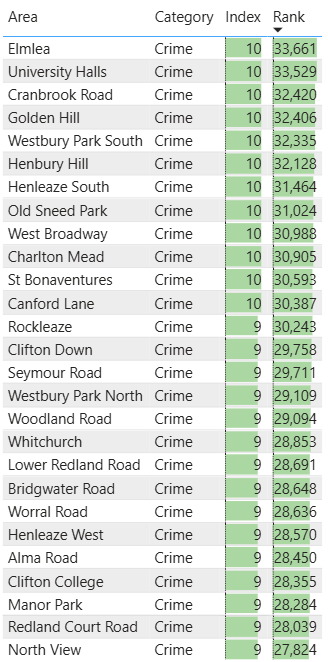
Crime
Measures the lower risk of personal and material victimisation in the locality.
So What?
I think it is very useful to look at this data through the lens of "privilege" rather than "deprivation" as this can help people think about some privileges they might consider having less of in order to improve the lives of the majority of people in Bristol.
You could always choose to donate some money to the "Local Crisis Prevention Fund".
Bonus Gift
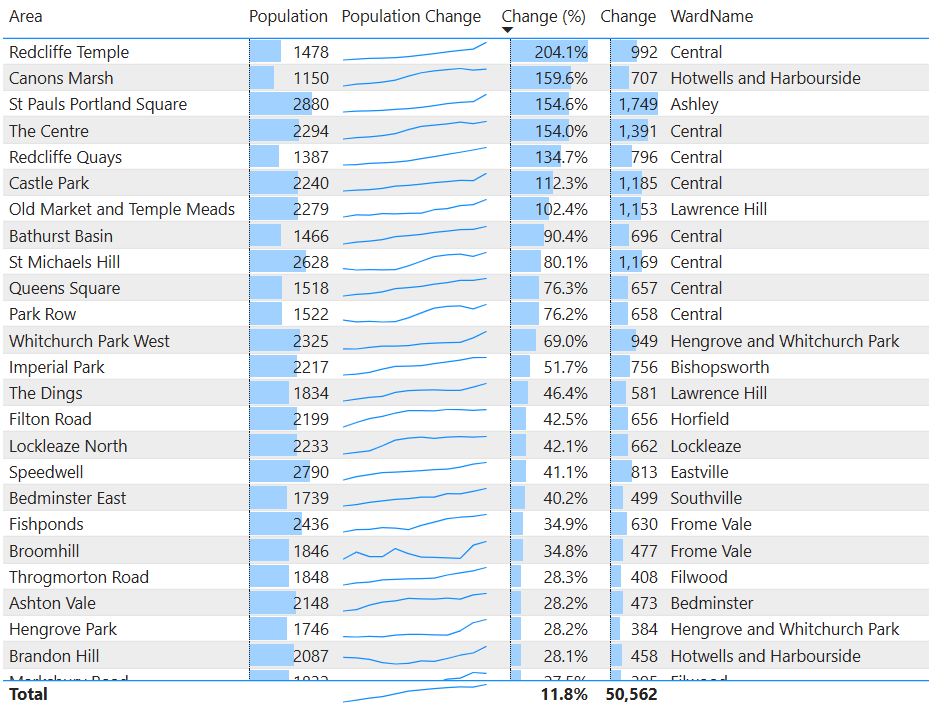
As part of the analysis for this article I had to add a lot of "LSOA" Area data to my reports. You can now see population figures for all of these 268 local areas in the Neighbourhoods" report between 2011 and 2022.
Comments ()