
Bedminster is the HMO Capital of Bristol
According to Bristol City Council:
A 10% threshold of HMOs in a neighborhood is considered a "tipping point" where negative impacts on residential amenity and community cohesion are likely. See HMO Density Evidence Paper
I have written about my efforts to get hold of Property License data, and have finally managed to get hold of the data that can be used to analyse the HMO Density at the level of a Ward, Post Code and Individual Streets. I have taken the data from the Bristol City Council Register of licensed properties and published the HMO Density reports on BU.
The 100 Metre HMO Density Measure
HMO Density is typically measured by looking at properties within 100 metres of a specific point. You count the number of properties in the circle and how many of those properties are HMOs to calculate the HMO Density. This is the measure used by Bristol City Council.
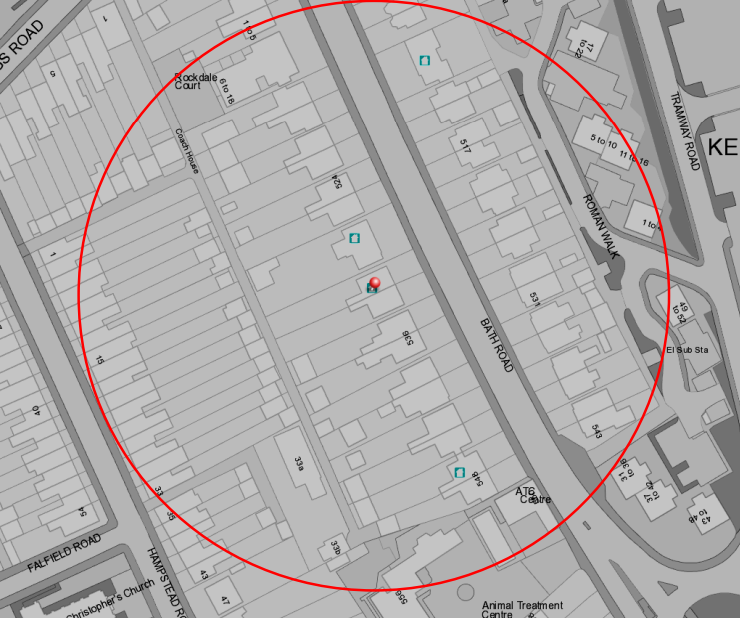
It can be difficult to make this calculation unless you can use specialist mapping software that can show a 100m radius on a map. I have not used this measure on Bristol Uncovered due to the complexity with the calculations required.
I have created HMO Density measures for Streets, Post Codes and Wards. I think these are more useful measures for assessing the density of HMOs in Bristol.
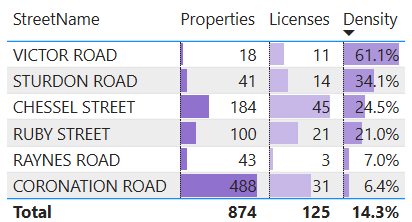
The Street Density Measure
This method looks at the properties on a single street, which can be more useful at assessing the impact of additional HMOs.
Here are some examples of the calculations for the Street Density measure.
But where you have very long streets, or very short ones, using the post code measure might be better.
The Post Code Density Measure
If you live on a very big road (e.g. Coronation Road with 488 properties) it can be more useful to look at the HMO Density for a specific postcode. This is the HMO Density for the BS3 1RL postcode (on Coronation Road).
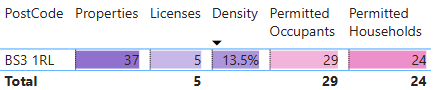
The whole of Coronation Road has a HMO Density of 6.4% and the BS3 1RL Post Code Density is 13.5%
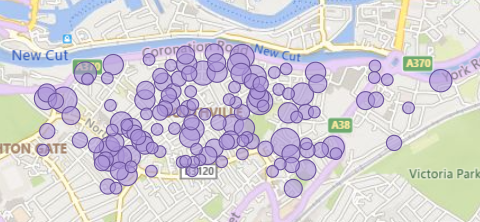
This map shows the Post Code Density in Southville. The more HMOs in a post code, the bigger the bubble.
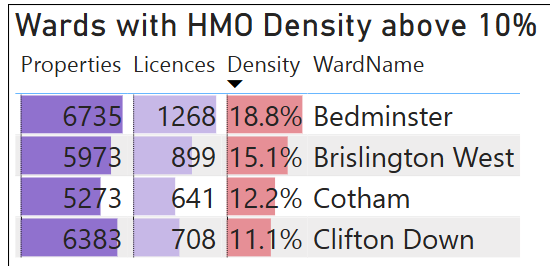
The Ward Density Measure
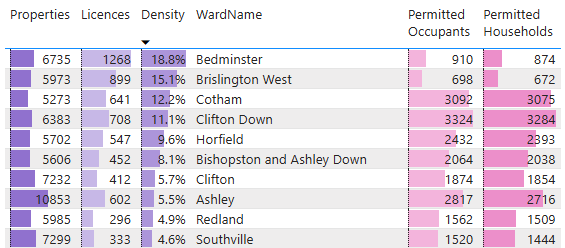
This measure isn't very useful for a local area, but it does give useful information about which Wards have the highest proportion of licensed HMOs. This table shows that 4 of the "Top 10" Wards have a density of more than 10% which is "where negative impacts on residential amenity and community cohesion are likely".
Comments ()